Carpatho Rusyn vs Celtic Child Poverty Under the Age of 5
COMPARE
Carpatho Rusyn
Celtic
Child Poverty Under the Age of 5
Child Poverty Under the Age of 5 Comparison
Carpatho Rusyns
Celtics
17.5%
CHILD POVERTY UNDER THE AGE OF 5
33.6/ 100
METRIC RATING
188th/ 347
METRIC RANK
17.9%
CHILD POVERTY UNDER THE AGE OF 5
18.3/ 100
METRIC RATING
198th/ 347
METRIC RANK
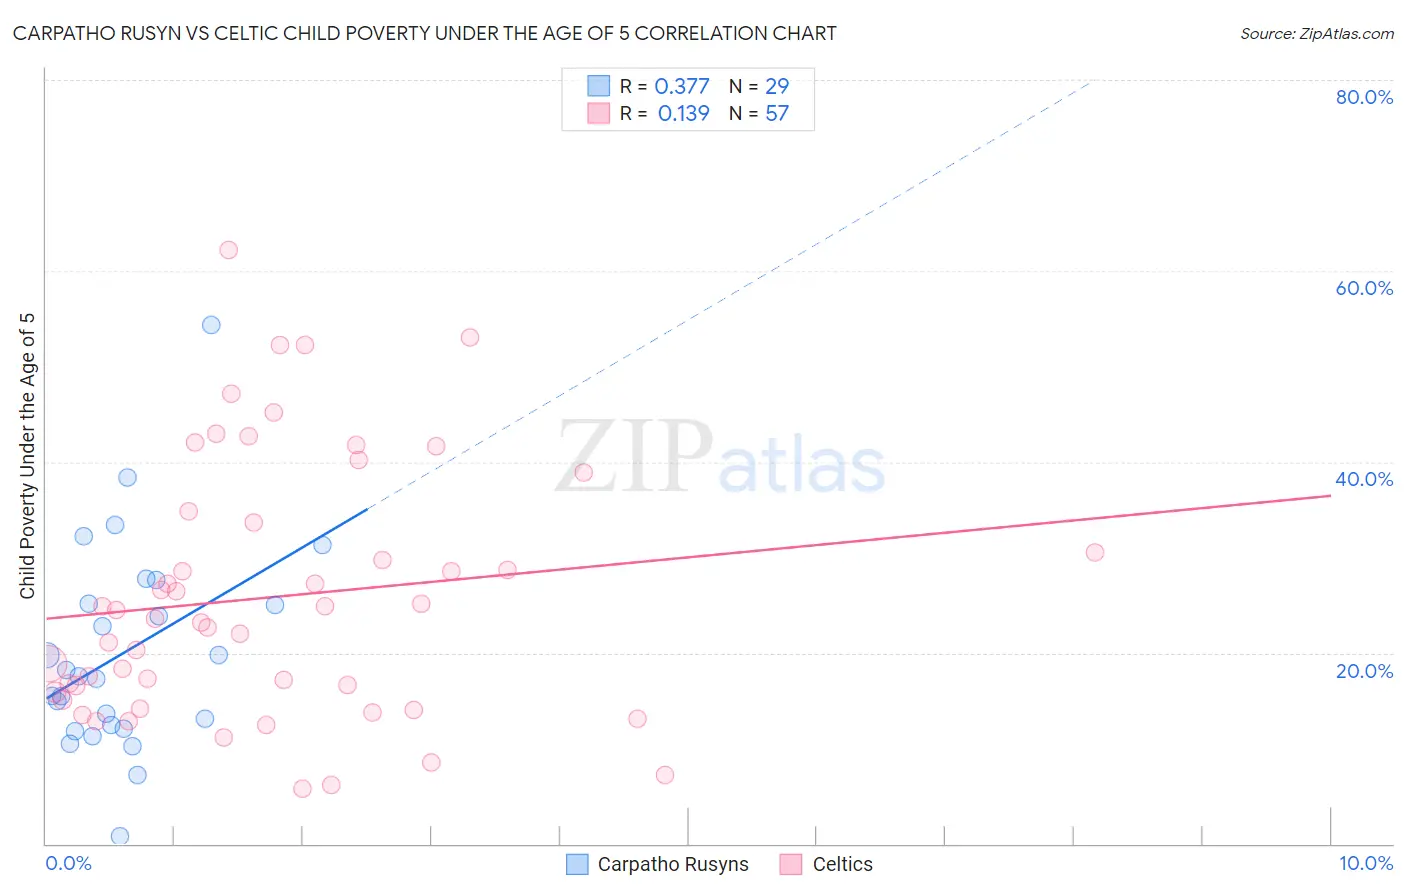
Carpatho Rusyn vs Celtic Child Poverty Under the Age of 5 Correlation Chart
The statistical analysis conducted on geographies consisting of 57,729,795 people shows a mild positive correlation between the proportion of Carpatho Rusyns and poverty level among children under the age of 5 in the United States with a correlation coefficient (R) of 0.377 and weighted average of 17.5%. Similarly, the statistical analysis conducted on geographies consisting of 165,160,308 people shows a poor positive correlation between the proportion of Celtics and poverty level among children under the age of 5 in the United States with a correlation coefficient (R) of 0.139 and weighted average of 17.9%, a difference of 2.1%.
Child Poverty Under the Age of 5 Correlation Summary
| Measurement | Carpatho Rusyn | Celtic |
| Minimum | 0.75% | 5.7% |
| Maximum | 54.4% | 62.3% |
| Range | 53.6% | 56.5% |
| Mean | 20.1% | 25.8% |
| Median | 17.6% | 23.6% |
| Interquartile 25% (IQ1) | 12.2% | 15.5% |
| Interquartile 75% (IQ3) | 26.4% | 34.3% |
| Interquartile Range (IQR) | 14.1% | 18.8% |
| Standard Deviation (Sample) | 10.9% | 13.4% |
| Standard Deviation (Population) | 10.7% | 13.3% |
Demographics Similar to Carpatho Rusyns and Celtics by Child Poverty Under the Age of 5
In terms of child poverty under the age of 5, the demographic groups most similar to Carpatho Rusyns are French (17.5%, a difference of 0.010%), Kenyan (17.5%, a difference of 0.12%), Immigrants from Bosnia and Herzegovina (17.5%, a difference of 0.16%), Immigrants from Armenia (17.5%, a difference of 0.49%), and Slovak (17.6%, a difference of 0.53%). Similarly, the demographic groups most similar to Celtics are Hungarian (17.9%, a difference of 0.010%), Immigrants from Kenya (17.9%, a difference of 0.28%), Immigrants from Portugal (17.8%, a difference of 0.60%), Iraqi (18.0%, a difference of 0.81%), and Ugandan (18.0%, a difference of 0.82%).
| Demographics | Rating | Rank | Child Poverty Under the Age of 5 |
| Lebanese | 40.3 /100 | #183 | Average 17.4% |
| Immigrants | Costa Rica | 39.0 /100 | #184 | Fair 17.4% |
| Immigrants | Armenia | 38.0 /100 | #185 | Fair 17.5% |
| Immigrants | Bosnia and Herzegovina | 35.0 /100 | #186 | Fair 17.5% |
| Kenyans | 34.7 /100 | #187 | Fair 17.5% |
| Carpatho Rusyns | 33.6 /100 | #188 | Fair 17.5% |
| French | 33.6 /100 | #189 | Fair 17.5% |
| Slovaks | 29.2 /100 | #190 | Fair 17.6% |
| Immigrants | Afghanistan | 27.9 /100 | #191 | Fair 17.7% |
| Immigrants | Uruguay | 27.8 /100 | #192 | Fair 17.7% |
| Immigrants | Uganda | 25.0 /100 | #193 | Fair 17.7% |
| French Canadians | 24.6 /100 | #194 | Fair 17.7% |
| Sierra Leoneans | 24.1 /100 | #195 | Fair 17.7% |
| Immigrants | Portugal | 22.2 /100 | #196 | Fair 17.8% |
| Immigrants | Kenya | 20.0 /100 | #197 | Fair 17.9% |
| Celtics | 18.3 /100 | #198 | Poor 17.9% |
| Hungarians | 18.3 /100 | #199 | Poor 17.9% |
| Iraqis | 14.0 /100 | #200 | Poor 18.0% |
| Ugandans | 13.9 /100 | #201 | Poor 18.0% |
| Japanese | 13.8 /100 | #202 | Poor 18.1% |
| Immigrants | Cambodia | 13.7 /100 | #203 | Poor 18.1% |