Immigrants vs Immigrants from Portugal Unemployment
COMPARE
Immigrants
Immigrants from Portugal
Unemployment
Unemployment Comparison
Immigrants
Immigrants from Portugal
5.5%
UNEMPLOYMENT
2.6/ 100
METRIC RATING
239th/ 347
METRIC RANK
5.7%
UNEMPLOYMENT
0.2/ 100
METRIC RATING
255th/ 347
METRIC RANK
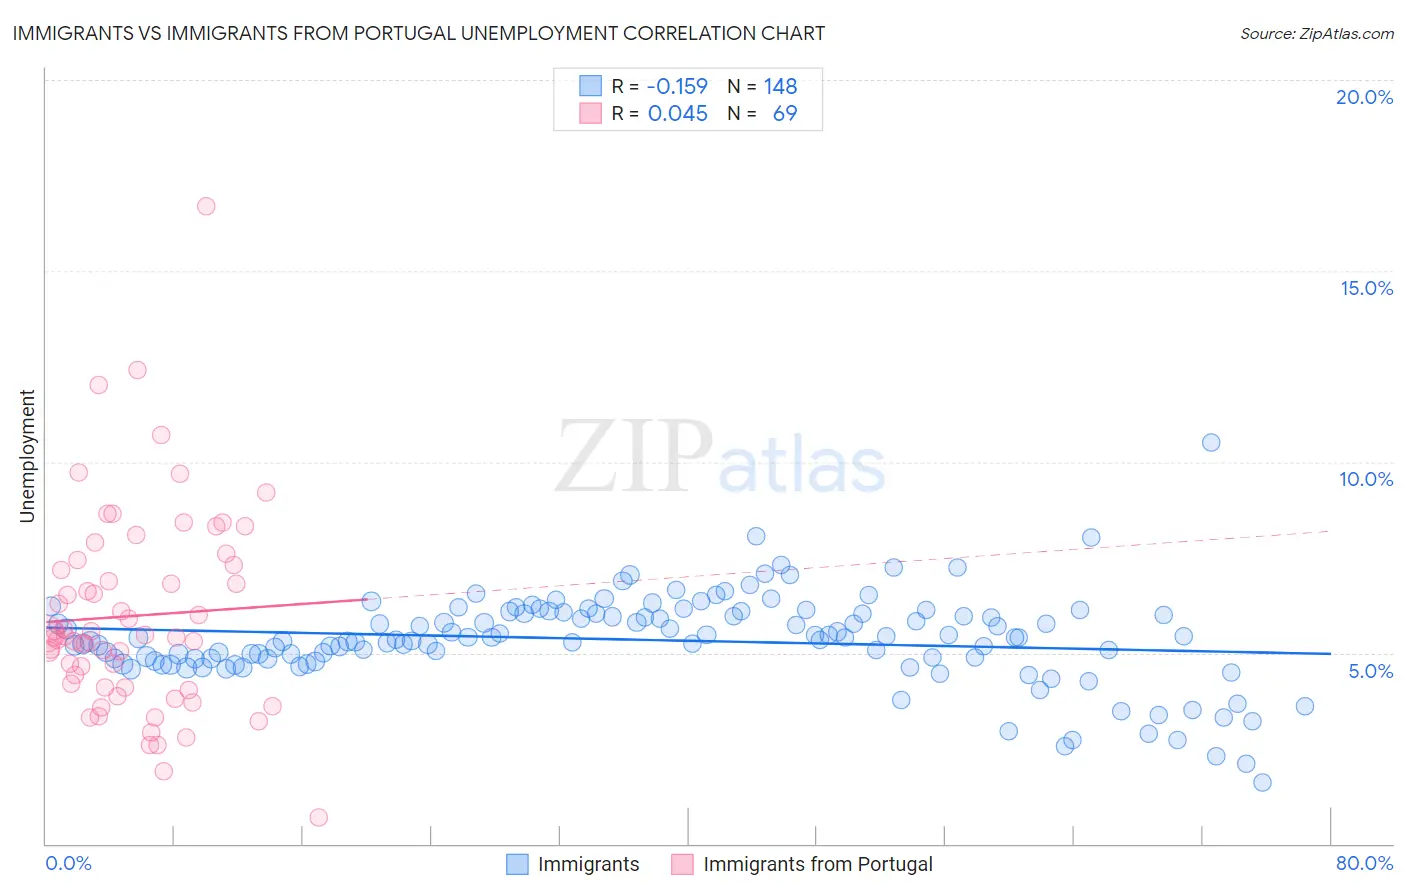
Immigrants vs Immigrants from Portugal Unemployment Correlation Chart
The statistical analysis conducted on geographies consisting of 573,511,766 people shows a poor negative correlation between the proportion of Immigrants and unemployment in the United States with a correlation coefficient (R) of -0.159 and weighted average of 5.5%. Similarly, the statistical analysis conducted on geographies consisting of 174,742,748 people shows no correlation between the proportion of Immigrants from Portugal and unemployment in the United States with a correlation coefficient (R) of 0.045 and weighted average of 5.7%, a difference of 3.6%.
Unemployment Correlation Summary
| Measurement | Immigrants | Immigrants from Portugal |
| Minimum | 1.6% | 0.70% |
| Maximum | 10.5% | 16.7% |
| Range | 8.9% | 16.0% |
| Mean | 5.3% | 6.0% |
| Median | 5.4% | 5.4% |
| Interquartile 25% (IQ1) | 4.8% | 4.1% |
| Interquartile 75% (IQ3) | 6.0% | 7.4% |
| Interquartile Range (IQR) | 1.2% | 3.3% |
| Standard Deviation (Sample) | 1.2% | 2.7% |
| Standard Deviation (Population) | 1.2% | 2.6% |
Demographics Similar to Immigrants and Immigrants from Portugal by Unemployment
In terms of unemployment, the demographic groups most similar to Immigrants are Cree (5.6%, a difference of 0.010%), Immigrants from Western Asia (5.5%, a difference of 0.090%), Moroccan (5.5%, a difference of 0.29%), Tlingit-Haida (5.6%, a difference of 0.35%), and Spanish American (5.6%, a difference of 0.36%). Similarly, the demographic groups most similar to Immigrants from Portugal are Guatemalan (5.8%, a difference of 0.21%), Immigrants from Honduras (5.7%, a difference of 0.44%), Yaqui (5.8%, a difference of 0.51%), Central American (5.7%, a difference of 0.52%), and Honduran (5.7%, a difference of 0.53%).
| Demographics | Rating | Rank | Unemployment |
| Moroccans | 3.2 /100 | #237 | Tragic 5.5% |
| Immigrants | Western Asia | 2.8 /100 | #238 | Tragic 5.5% |
| Immigrants | Immigrants | 2.6 /100 | #239 | Tragic 5.5% |
| Cree | 2.6 /100 | #240 | Tragic 5.6% |
| Tlingit-Haida | 2.0 /100 | #241 | Tragic 5.6% |
| Spanish Americans | 2.0 /100 | #242 | Tragic 5.6% |
| Marshallese | 1.3 /100 | #243 | Tragic 5.6% |
| Dutch West Indians | 1.2 /100 | #244 | Tragic 5.6% |
| French American Indians | 1.2 /100 | #245 | Tragic 5.6% |
| Bermudans | 1.1 /100 | #246 | Tragic 5.6% |
| Immigrants | Cameroon | 1.0 /100 | #247 | Tragic 5.6% |
| Liberians | 0.9 /100 | #248 | Tragic 5.6% |
| Cajuns | 0.8 /100 | #249 | Tragic 5.6% |
| Japanese | 0.8 /100 | #250 | Tragic 5.6% |
| Kiowa | 0.6 /100 | #251 | Tragic 5.7% |
| Hondurans | 0.3 /100 | #252 | Tragic 5.7% |
| Central Americans | 0.3 /100 | #253 | Tragic 5.7% |
| Immigrants | Honduras | 0.3 /100 | #254 | Tragic 5.7% |
| Immigrants | Portugal | 0.2 /100 | #255 | Tragic 5.7% |
| Guatemalans | 0.2 /100 | #256 | Tragic 5.8% |
| Yaqui | 0.2 /100 | #257 | Tragic 5.8% |