Immigrants from Zimbabwe vs Immigrants from Spain Single Male Poverty
COMPARE
Immigrants from Zimbabwe
Immigrants from Spain
Single Male Poverty
Single Male Poverty Comparison
Immigrants from Zimbabwe
Immigrants from Spain
12.6%
SINGLE MALE POVERTY
78.0/ 100
METRIC RATING
140th/ 347
METRIC RANK
12.7%
SINGLE MALE POVERTY
68.7/ 100
METRIC RATING
155th/ 347
METRIC RANK
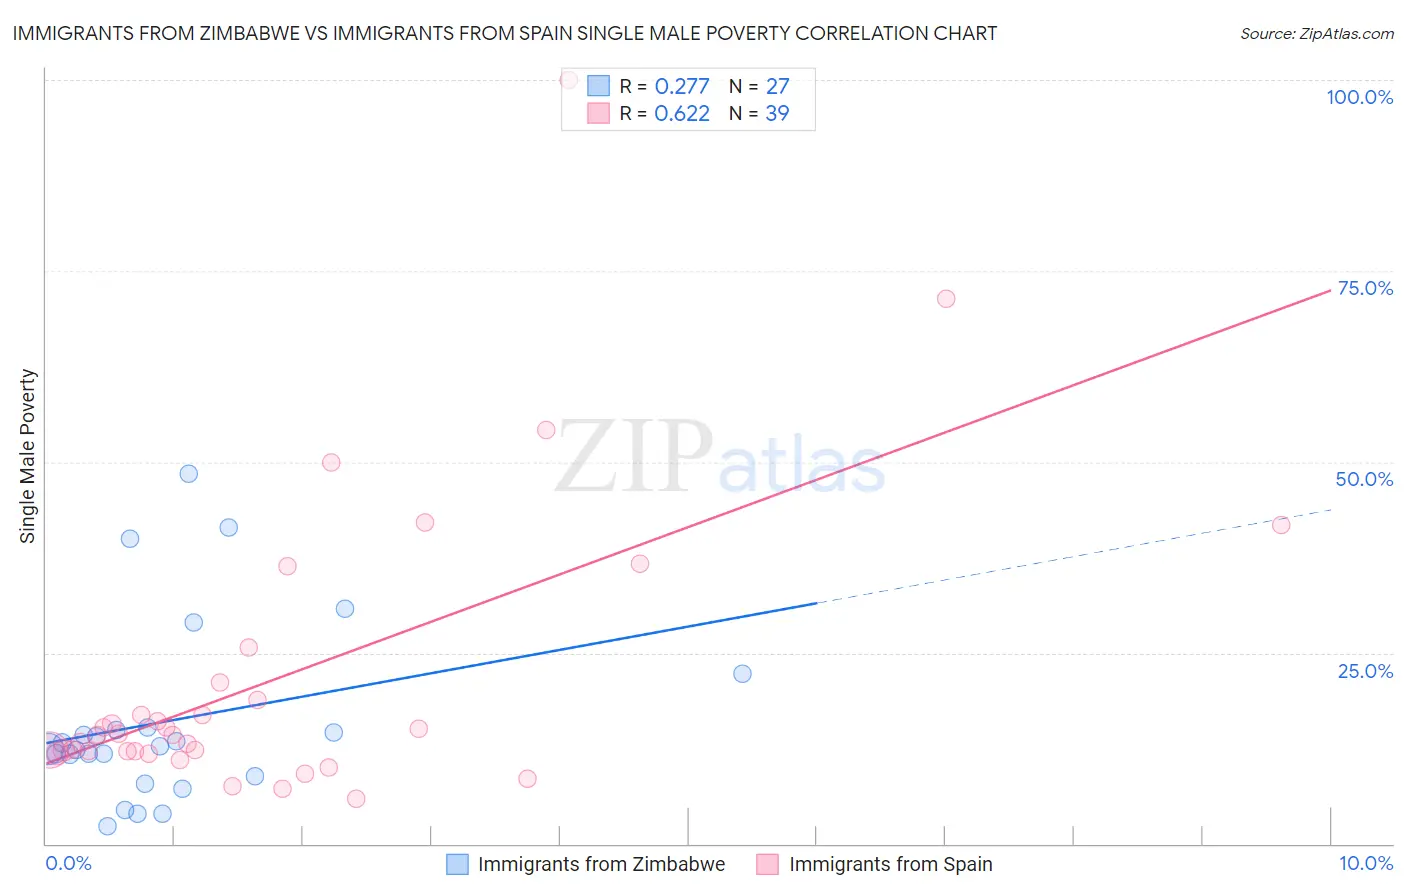
Immigrants from Zimbabwe vs Immigrants from Spain Single Male Poverty Correlation Chart
The statistical analysis conducted on geographies consisting of 112,161,655 people shows a weak positive correlation between the proportion of Immigrants from Zimbabwe and poverty level among single males in the United States with a correlation coefficient (R) of 0.277 and weighted average of 12.6%. Similarly, the statistical analysis conducted on geographies consisting of 219,998,655 people shows a significant positive correlation between the proportion of Immigrants from Spain and poverty level among single males in the United States with a correlation coefficient (R) of 0.622 and weighted average of 12.7%, a difference of 0.65%.
Single Male Poverty Correlation Summary
| Measurement | Immigrants from Zimbabwe | Immigrants from Spain |
| Minimum | 2.3% | 5.9% |
| Maximum | 48.4% | 100.0% |
| Range | 46.1% | 94.1% |
| Mean | 16.1% | 21.7% |
| Median | 12.7% | 14.2% |
| Interquartile 25% (IQ1) | 8.9% | 12.1% |
| Interquartile 75% (IQ3) | 15.3% | 21.0% |
| Interquartile Range (IQR) | 6.4% | 9.0% |
| Standard Deviation (Sample) | 11.8% | 19.4% |
| Standard Deviation (Population) | 11.6% | 19.2% |
Demographics Similar to Immigrants from Zimbabwe and Immigrants from Spain by Single Male Poverty
In terms of single male poverty, the demographic groups most similar to Immigrants from Zimbabwe are Cuban (12.6%, a difference of 0.15%), Immigrants from El Salvador (12.6%, a difference of 0.16%), Okinawan (12.6%, a difference of 0.16%), Immigrants from Uganda (12.6%, a difference of 0.16%), and Immigrants from France (12.6%, a difference of 0.17%). Similarly, the demographic groups most similar to Immigrants from Spain are Immigrants from Scotland (12.7%, a difference of 0.020%), Vietnamese (12.7%, a difference of 0.040%), Latvian (12.7%, a difference of 0.040%), Immigrants (12.7%, a difference of 0.090%), and Australian (12.6%, a difference of 0.17%).
| Demographics | Rating | Rank | Single Male Poverty |
| Ukrainians | 80.7 /100 | #137 | Excellent 12.6% |
| Immigrants | El Salvador | 80.0 /100 | #138 | Excellent 12.6% |
| Cubans | 79.9 /100 | #139 | Good 12.6% |
| Immigrants | Zimbabwe | 78.0 /100 | #140 | Good 12.6% |
| Okinawans | 75.9 /100 | #141 | Good 12.6% |
| Immigrants | Uganda | 75.9 /100 | #142 | Good 12.6% |
| Immigrants | France | 75.8 /100 | #143 | Good 12.6% |
| Hawaiians | 75.1 /100 | #144 | Good 12.6% |
| Immigrants | Lebanon | 75.0 /100 | #145 | Good 12.6% |
| Native Hawaiians | 75.0 /100 | #146 | Good 12.6% |
| Malaysians | 74.8 /100 | #147 | Good 12.6% |
| Yugoslavians | 73.9 /100 | #148 | Good 12.6% |
| Sierra Leoneans | 73.0 /100 | #149 | Good 12.6% |
| Immigrants | Panama | 72.1 /100 | #150 | Good 12.6% |
| Immigrants | Hungary | 71.9 /100 | #151 | Good 12.6% |
| Australians | 71.4 /100 | #152 | Good 12.6% |
| Immigrants | Immigrants | 70.1 /100 | #153 | Good 12.7% |
| Immigrants | Scotland | 68.9 /100 | #154 | Good 12.7% |
| Immigrants | Spain | 68.7 /100 | #155 | Good 12.7% |
| Vietnamese | 67.9 /100 | #156 | Good 12.7% |
| Latvians | 67.9 /100 | #157 | Good 12.7% |