Immigrants from Zimbabwe vs Alsatian Householder Income Ages 25 - 44 years
COMPARE
Immigrants from Zimbabwe
Alsatian
Householder Income Ages 25 - 44 years
Householder Income Ages 25 - 44 years Comparison
Immigrants from Zimbabwe
Alsatians
$97,880
HOUSEHOLDER INCOME AGES 25 - 44 YEARS
86.3/ 100
METRIC RATING
132nd/ 347
METRIC RANK
$95,059
HOUSEHOLDER INCOME AGES 25 - 44 YEARS
56.8/ 100
METRIC RATING
168th/ 347
METRIC RANK
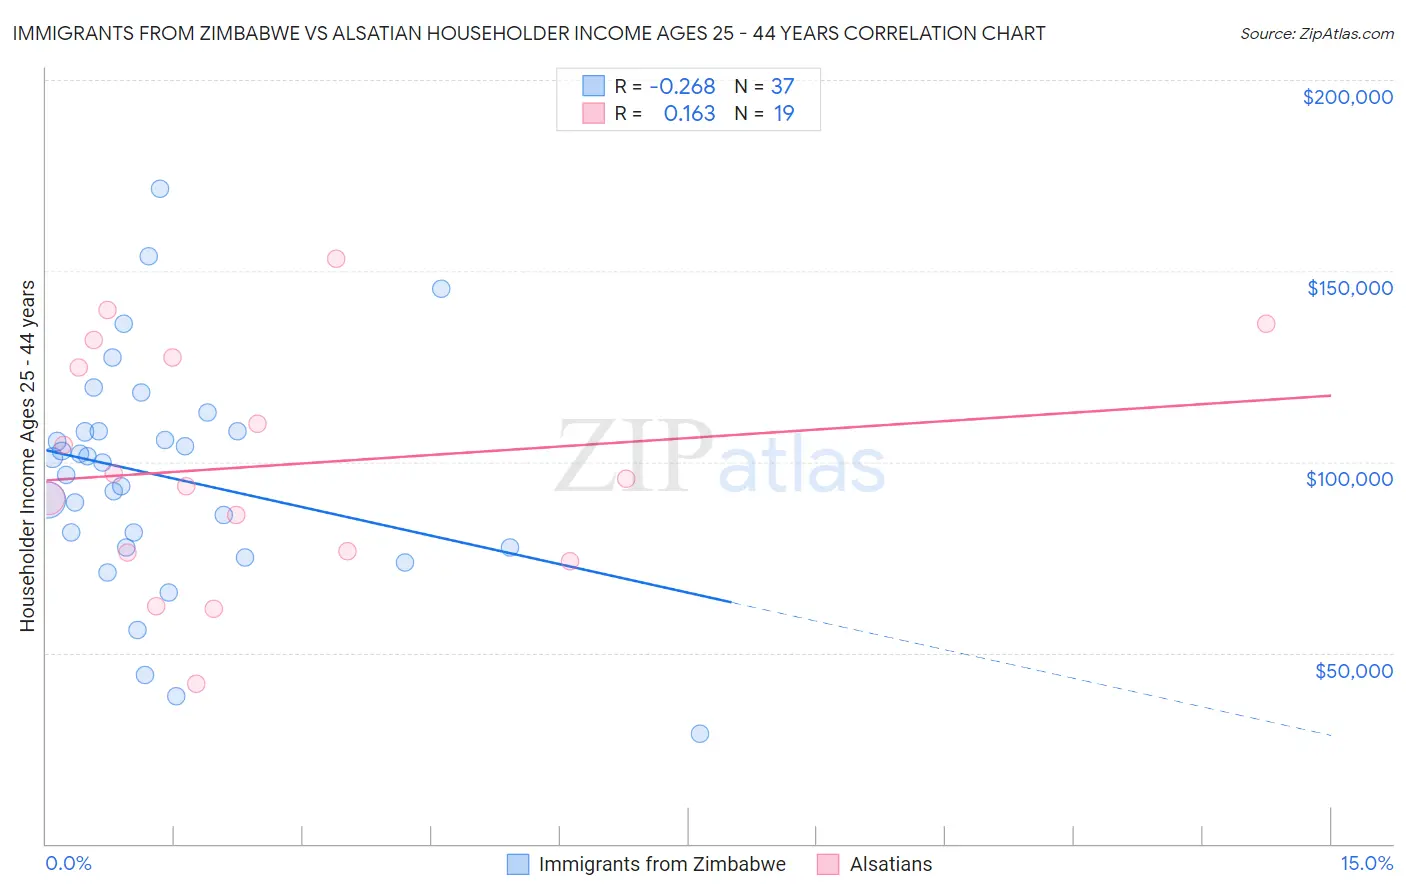
Immigrants from Zimbabwe vs Alsatian Householder Income Ages 25 - 44 years Correlation Chart
The statistical analysis conducted on geographies consisting of 117,746,283 people shows a weak negative correlation between the proportion of Immigrants from Zimbabwe and household income with householder between the ages 25 and 44 in the United States with a correlation coefficient (R) of -0.268 and weighted average of $97,880. Similarly, the statistical analysis conducted on geographies consisting of 82,595,947 people shows a poor positive correlation between the proportion of Alsatians and household income with householder between the ages 25 and 44 in the United States with a correlation coefficient (R) of 0.163 and weighted average of $95,059, a difference of 3.0%.
Householder Income Ages 25 - 44 years Correlation Summary
| Measurement | Immigrants from Zimbabwe | Alsatian |
| Minimum | $28,895 | $42,026 |
| Maximum | $171,540 | $153,077 |
| Range | $142,645 | $111,051 |
| Mean | $95,961 | $99,110 |
| Median | $99,716 | $95,529 |
| Interquartile 25% (IQ1) | $77,685 | $76,336 |
| Interquartile 75% (IQ3) | $107,912 | $127,229 |
| Interquartile Range (IQR) | $30,227 | $50,893 |
| Standard Deviation (Sample) | $29,842 | $30,381 |
| Standard Deviation (Population) | $29,436 | $29,570 |
Similar Demographics by Householder Income Ages 25 - 44 years
Demographics Similar to Immigrants from Zimbabwe by Householder Income Ages 25 - 44 years
In terms of householder income ages 25 - 44 years, the demographic groups most similar to Immigrants from Zimbabwe are Immigrants from Albania ($97,929, a difference of 0.050%), Tsimshian ($97,809, a difference of 0.070%), Immigrants from Kuwait ($98,122, a difference of 0.25%), Canadian ($97,625, a difference of 0.26%), and Immigrants from Oceania ($97,623, a difference of 0.26%).
| Demographics | Rating | Rank | Householder Income Ages 25 - 44 years |
| Pakistanis | 89.3 /100 | #125 | Excellent $98,401 |
| British | 89.1 /100 | #126 | Excellent $98,359 |
| Serbians | 88.9 /100 | #127 | Excellent $98,320 |
| Europeans | 88.9 /100 | #128 | Excellent $98,310 |
| Brazilians | 88.6 /100 | #129 | Excellent $98,267 |
| Immigrants | Kuwait | 87.8 /100 | #130 | Excellent $98,122 |
| Immigrants | Albania | 86.6 /100 | #131 | Excellent $97,929 |
| Immigrants | Zimbabwe | 86.3 /100 | #132 | Excellent $97,880 |
| Tsimshian | 85.8 /100 | #133 | Excellent $97,809 |
| Canadians | 84.5 /100 | #134 | Excellent $97,625 |
| Immigrants | Oceania | 84.5 /100 | #135 | Excellent $97,623 |
| Hungarians | 83.9 /100 | #136 | Excellent $97,544 |
| Lebanese | 82.3 /100 | #137 | Excellent $97,339 |
| Arabs | 82.3 /100 | #138 | Excellent $97,336 |
| Immigrants | Peru | 82.2 /100 | #139 | Excellent $97,329 |
Demographics Similar to Alsatians by Householder Income Ages 25 - 44 years
In terms of householder income ages 25 - 44 years, the demographic groups most similar to Alsatians are Native Hawaiian ($95,058, a difference of 0.0%), Czechoslovakian ($95,070, a difference of 0.010%), Slovak ($95,032, a difference of 0.030%), Immigrants from Armenia ($94,867, a difference of 0.20%), and Immigrants from Ethiopia ($95,256, a difference of 0.21%).
| Demographics | Rating | Rank | Householder Income Ages 25 - 44 years |
| Immigrants | Portugal | 62.8 /100 | #161 | Good $95,512 |
| Swiss | 62.8 /100 | #162 | Good $95,511 |
| Immigrants | Saudi Arabia | 62.0 /100 | #163 | Good $95,450 |
| South Americans | 60.9 /100 | #164 | Good $95,362 |
| Immigrants | Nepal | 60.3 /100 | #165 | Good $95,322 |
| Immigrants | Ethiopia | 59.5 /100 | #166 | Average $95,256 |
| Czechoslovakians | 57.0 /100 | #167 | Average $95,070 |
| Alsatians | 56.8 /100 | #168 | Average $95,059 |
| Native Hawaiians | 56.8 /100 | #169 | Average $95,058 |
| Slovaks | 56.4 /100 | #170 | Average $95,032 |
| Immigrants | Armenia | 54.2 /100 | #171 | Average $94,867 |
| Scottish | 50.8 /100 | #172 | Average $94,622 |
| Finns | 50.6 /100 | #173 | Average $94,610 |
| Colombians | 50.0 /100 | #174 | Average $94,565 |
| English | 48.1 /100 | #175 | Average $94,429 |