Immigrants from Zaire vs Basque Seniors Poverty Over the Age of 65
COMPARE
Immigrants from Zaire
Basque
Seniors Poverty Over the Age of 65
Seniors Poverty Over the Age of 65 Comparison
Immigrants from Zaire
Basques
11.3%
SENIORS POVERTY OVER THE AGE OF 65
16.9/ 100
METRIC RATING
203rd/ 347
METRIC RANK
10.2%
SENIORS POVERTY OVER THE AGE OF 65
95.9/ 100
METRIC RATING
96th/ 347
METRIC RANK
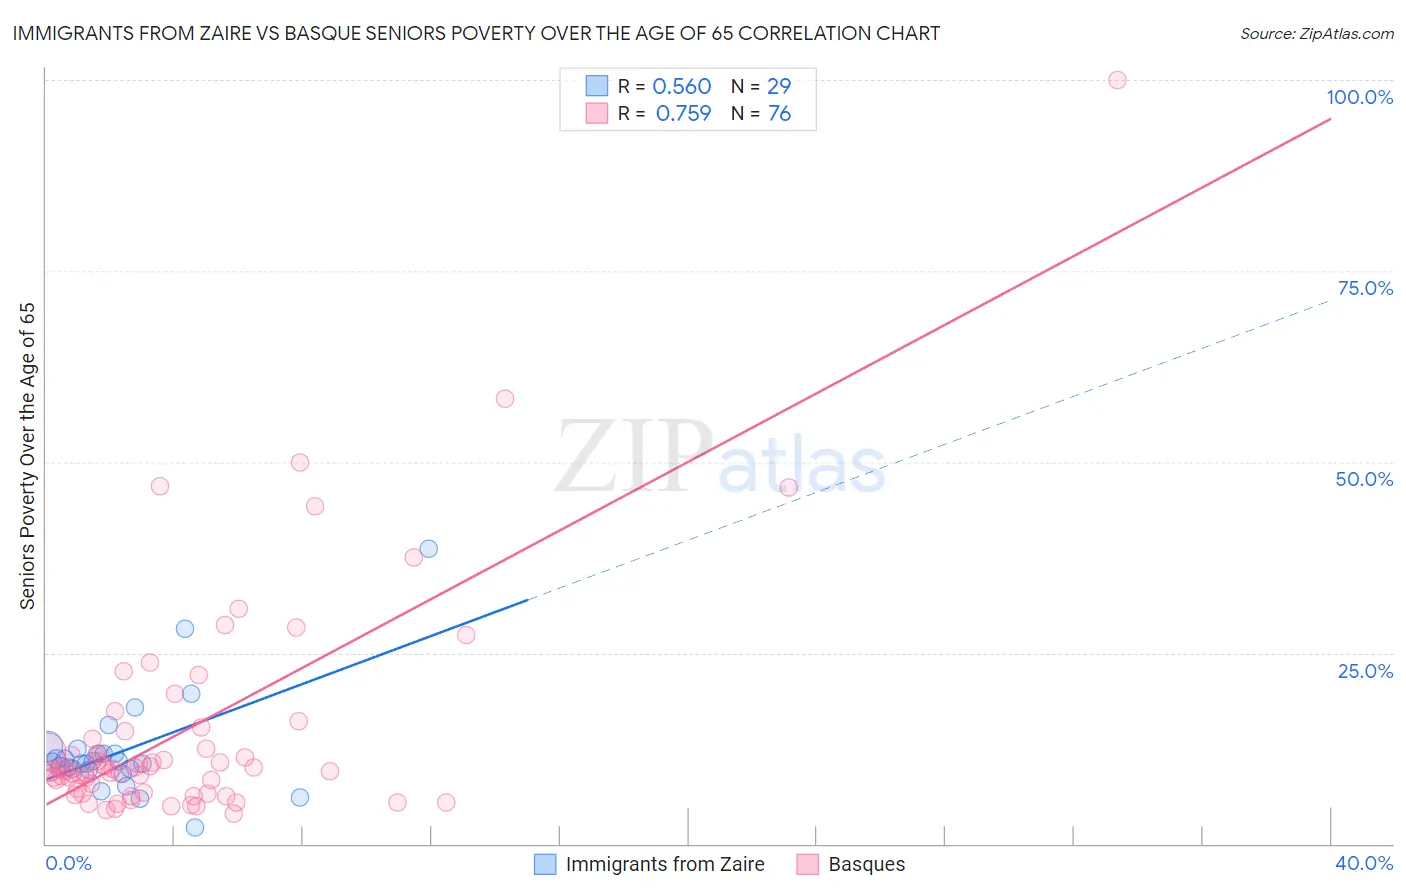
Immigrants from Zaire vs Basque Seniors Poverty Over the Age of 65 Correlation Chart
The statistical analysis conducted on geographies consisting of 107,186,275 people shows a substantial positive correlation between the proportion of Immigrants from Zaire and poverty level among seniors over the age of 65 in the United States with a correlation coefficient (R) of 0.560 and weighted average of 11.3%. Similarly, the statistical analysis conducted on geographies consisting of 165,550,179 people shows a strong positive correlation between the proportion of Basques and poverty level among seniors over the age of 65 in the United States with a correlation coefficient (R) of 0.759 and weighted average of 10.2%, a difference of 11.3%.
Seniors Poverty Over the Age of 65 Correlation Summary
| Measurement | Immigrants from Zaire | Basque |
| Minimum | 2.2% | 3.9% |
| Maximum | 38.6% | 100.0% |
| Range | 36.5% | 96.1% |
| Mean | 12.2% | 14.9% |
| Median | 10.6% | 9.8% |
| Interquartile 25% (IQ1) | 9.7% | 6.9% |
| Interquartile 75% (IQ3) | 12.1% | 14.2% |
| Interquartile Range (IQR) | 2.4% | 7.3% |
| Standard Deviation (Sample) | 6.9% | 15.2% |
| Standard Deviation (Population) | 6.8% | 15.1% |
Similar Demographics by Seniors Poverty Over the Age of 65
Demographics Similar to Immigrants from Zaire by Seniors Poverty Over the Age of 65
In terms of seniors poverty over the age of 65, the demographic groups most similar to Immigrants from Zaire are Costa Rican (11.3%, a difference of 0.010%), Israeli (11.3%, a difference of 0.070%), Immigrants from Brazil (11.3%, a difference of 0.13%), Brazilian (11.3%, a difference of 0.24%), and Choctaw (11.4%, a difference of 0.38%).
| Demographics | Rating | Rank | Seniors Poverty Over the Age of 65 |
| Bangladeshis | 25.2 /100 | #196 | Fair 11.2% |
| Albanians | 24.4 /100 | #197 | Fair 11.2% |
| Immigrants | Burma/Myanmar | 21.3 /100 | #198 | Fair 11.3% |
| Immigrants | Israel | 20.3 /100 | #199 | Fair 11.3% |
| Alsatians | 20.1 /100 | #200 | Fair 11.3% |
| Immigrants | Brazil | 17.8 /100 | #201 | Poor 11.3% |
| Costa Ricans | 17.0 /100 | #202 | Poor 11.3% |
| Immigrants | Zaire | 16.9 /100 | #203 | Poor 11.3% |
| Israelis | 16.5 /100 | #204 | Poor 11.3% |
| Brazilians | 15.4 /100 | #205 | Poor 11.3% |
| Choctaw | 14.5 /100 | #206 | Poor 11.4% |
| Immigrants | Western Asia | 13.6 /100 | #207 | Poor 11.4% |
| South American Indians | 11.7 /100 | #208 | Poor 11.4% |
| Paraguayans | 11.3 /100 | #209 | Poor 11.4% |
| Ugandans | 11.2 /100 | #210 | Poor 11.4% |
Demographics Similar to Basques by Seniors Poverty Over the Age of 65
In terms of seniors poverty over the age of 65, the demographic groups most similar to Basques are Immigrants from Pakistan (10.2%, a difference of 0.090%), Immigrants from Kuwait (10.2%, a difference of 0.24%), Cypriot (10.2%, a difference of 0.25%), Immigrants from Japan (10.1%, a difference of 0.28%), and Marshallese (10.2%, a difference of 0.31%).
| Demographics | Rating | Rank | Seniors Poverty Over the Age of 65 |
| Immigrants | Bulgaria | 97.0 /100 | #89 | Exceptional 10.1% |
| Ukrainians | 96.9 /100 | #90 | Exceptional 10.1% |
| Puget Sound Salish | 96.9 /100 | #91 | Exceptional 10.1% |
| Immigrants | Singapore | 96.9 /100 | #92 | Exceptional 10.1% |
| Immigrants | Sweden | 96.7 /100 | #93 | Exceptional 10.1% |
| Immigrants | Germany | 96.7 /100 | #94 | Exceptional 10.1% |
| Immigrants | Japan | 96.3 /100 | #95 | Exceptional 10.1% |
| Basques | 95.9 /100 | #96 | Exceptional 10.2% |
| Immigrants | Pakistan | 95.7 /100 | #97 | Exceptional 10.2% |
| Immigrants | Kuwait | 95.5 /100 | #98 | Exceptional 10.2% |
| Cypriots | 95.5 /100 | #99 | Exceptional 10.2% |
| Marshallese | 95.3 /100 | #100 | Exceptional 10.2% |
| Immigrants | Jordan | 94.7 /100 | #101 | Exceptional 10.2% |
| Delaware | 94.5 /100 | #102 | Exceptional 10.2% |
| Icelanders | 94.4 /100 | #103 | Exceptional 10.3% |