Immigrants from Zaire vs Immigrants from Costa Rica Seniors Poverty Over the Age of 65
COMPARE
Immigrants from Zaire
Immigrants from Costa Rica
Seniors Poverty Over the Age of 65
Seniors Poverty Over the Age of 65 Comparison
Immigrants from Zaire
Immigrants from Costa Rica
11.3%
SENIORS POVERTY OVER THE AGE OF 65
16.9/ 100
METRIC RATING
203rd/ 347
METRIC RANK
11.8%
SENIORS POVERTY OVER THE AGE OF 65
2.7/ 100
METRIC RATING
228th/ 347
METRIC RANK
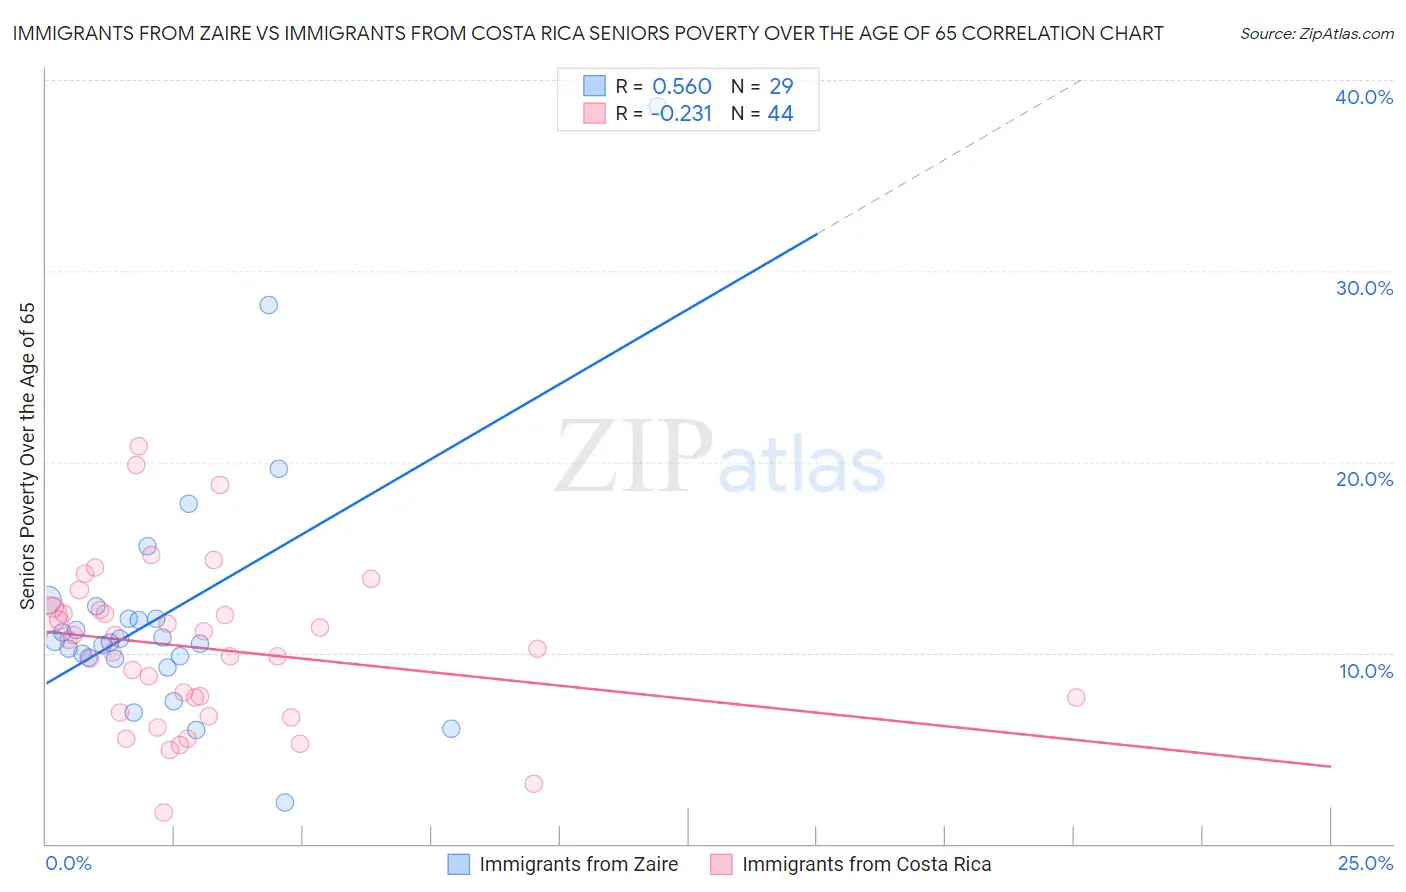
Immigrants from Zaire vs Immigrants from Costa Rica Seniors Poverty Over the Age of 65 Correlation Chart
The statistical analysis conducted on geographies consisting of 107,186,275 people shows a substantial positive correlation between the proportion of Immigrants from Zaire and poverty level among seniors over the age of 65 in the United States with a correlation coefficient (R) of 0.560 and weighted average of 11.3%. Similarly, the statistical analysis conducted on geographies consisting of 204,045,079 people shows a weak negative correlation between the proportion of Immigrants from Costa Rica and poverty level among seniors over the age of 65 in the United States with a correlation coefficient (R) of -0.231 and weighted average of 11.8%, a difference of 4.3%.
Seniors Poverty Over the Age of 65 Correlation Summary
| Measurement | Immigrants from Zaire | Immigrants from Costa Rica |
| Minimum | 2.2% | 1.7% |
| Maximum | 38.6% | 20.8% |
| Range | 36.5% | 19.1% |
| Mean | 12.2% | 10.3% |
| Median | 10.6% | 10.5% |
| Interquartile 25% (IQ1) | 9.7% | 7.3% |
| Interquartile 75% (IQ3) | 12.1% | 12.1% |
| Interquartile Range (IQR) | 2.4% | 4.9% |
| Standard Deviation (Sample) | 6.9% | 4.1% |
| Standard Deviation (Population) | 6.8% | 4.1% |
Similar Demographics by Seniors Poverty Over the Age of 65
Demographics Similar to Immigrants from Zaire by Seniors Poverty Over the Age of 65
In terms of seniors poverty over the age of 65, the demographic groups most similar to Immigrants from Zaire are Costa Rican (11.3%, a difference of 0.010%), Israeli (11.3%, a difference of 0.070%), Immigrants from Brazil (11.3%, a difference of 0.13%), Brazilian (11.3%, a difference of 0.24%), and Choctaw (11.4%, a difference of 0.38%).
| Demographics | Rating | Rank | Seniors Poverty Over the Age of 65 |
| Bangladeshis | 25.2 /100 | #196 | Fair 11.2% |
| Albanians | 24.4 /100 | #197 | Fair 11.2% |
| Immigrants | Burma/Myanmar | 21.3 /100 | #198 | Fair 11.3% |
| Immigrants | Israel | 20.3 /100 | #199 | Fair 11.3% |
| Alsatians | 20.1 /100 | #200 | Fair 11.3% |
| Immigrants | Brazil | 17.8 /100 | #201 | Poor 11.3% |
| Costa Ricans | 17.0 /100 | #202 | Poor 11.3% |
| Immigrants | Zaire | 16.9 /100 | #203 | Poor 11.3% |
| Israelis | 16.5 /100 | #204 | Poor 11.3% |
| Brazilians | 15.4 /100 | #205 | Poor 11.3% |
| Choctaw | 14.5 /100 | #206 | Poor 11.4% |
| Immigrants | Western Asia | 13.6 /100 | #207 | Poor 11.4% |
| South American Indians | 11.7 /100 | #208 | Poor 11.4% |
| Paraguayans | 11.3 /100 | #209 | Poor 11.4% |
| Ugandans | 11.2 /100 | #210 | Poor 11.4% |
Demographics Similar to Immigrants from Costa Rica by Seniors Poverty Over the Age of 65
In terms of seniors poverty over the age of 65, the demographic groups most similar to Immigrants from Costa Rica are Immigrants from Eritrea (11.8%, a difference of 0.080%), Nigerian (11.8%, a difference of 0.33%), Liberian (11.8%, a difference of 0.36%), Immigrants from Belarus (11.8%, a difference of 0.38%), and Immigrants from Nigeria (11.7%, a difference of 0.48%).
| Demographics | Rating | Rank | Seniors Poverty Over the Age of 65 |
| Argentineans | 4.1 /100 | #221 | Tragic 11.7% |
| Immigrants | Chile | 3.9 /100 | #222 | Tragic 11.7% |
| Immigrants | Congo | 3.8 /100 | #223 | Tragic 11.7% |
| Immigrants | Nigeria | 3.4 /100 | #224 | Tragic 11.7% |
| Immigrants | Belarus | 3.2 /100 | #225 | Tragic 11.8% |
| Liberians | 3.2 /100 | #226 | Tragic 11.8% |
| Nigerians | 3.2 /100 | #227 | Tragic 11.8% |
| Immigrants | Costa Rica | 2.7 /100 | #228 | Tragic 11.8% |
| Immigrants | Eritrea | 2.6 /100 | #229 | Tragic 11.8% |
| Bermudans | 2.1 /100 | #230 | Tragic 11.9% |
| Cajuns | 2.0 /100 | #231 | Tragic 11.9% |
| Yaqui | 1.9 /100 | #232 | Tragic 11.9% |
| Panamanians | 1.8 /100 | #233 | Tragic 11.9% |
| Iroquois | 1.7 /100 | #234 | Tragic 11.9% |
| Immigrants | Argentina | 1.3 /100 | #235 | Tragic 12.0% |