Immigrants from Zaire vs Basque 9th Grade
COMPARE
Immigrants from Zaire
Basque
9th Grade
9th Grade Comparison
Immigrants from Zaire
Basques
94.6%
9TH GRADE
20.6/ 100
METRIC RATING
200th/ 347
METRIC RANK
95.4%
9TH GRADE
94.1/ 100
METRIC RATING
129th/ 347
METRIC RANK
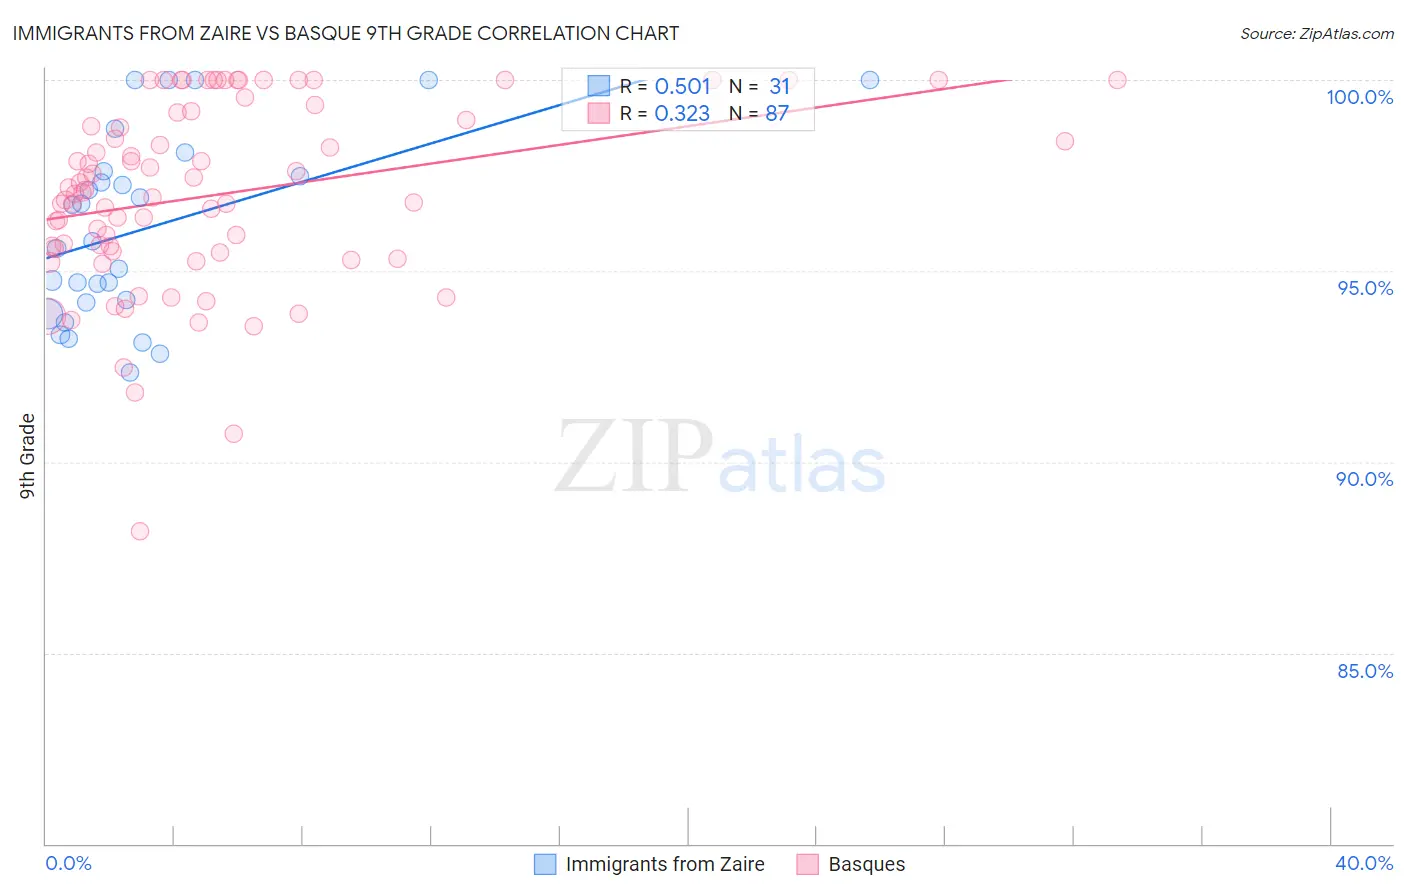
Immigrants from Zaire vs Basque 9th Grade Correlation Chart
The statistical analysis conducted on geographies consisting of 107,212,695 people shows a substantial positive correlation between the proportion of Immigrants from Zaire and percentage of population with at least 9th grade education in the United States with a correlation coefficient (R) of 0.501 and weighted average of 94.6%. Similarly, the statistical analysis conducted on geographies consisting of 165,777,136 people shows a mild positive correlation between the proportion of Basques and percentage of population with at least 9th grade education in the United States with a correlation coefficient (R) of 0.323 and weighted average of 95.4%, a difference of 0.76%.
9th Grade Correlation Summary
| Measurement | Immigrants from Zaire | Basque |
| Minimum | 92.3% | 88.2% |
| Maximum | 100.0% | 100.0% |
| Range | 7.7% | 11.8% |
| Mean | 96.1% | 97.0% |
| Median | 95.8% | 97.1% |
| Interquartile 25% (IQ1) | 94.2% | 95.5% |
| Interquartile 75% (IQ3) | 97.6% | 99.2% |
| Interquartile Range (IQR) | 3.4% | 3.6% |
| Standard Deviation (Sample) | 2.4% | 2.4% |
| Standard Deviation (Population) | 2.4% | 2.4% |
Similar Demographics by 9th Grade
Demographics Similar to Immigrants from Zaire by 9th Grade
In terms of 9th grade, the demographic groups most similar to Immigrants from Zaire are Laotian (94.6%, a difference of 0.0%), Black/African American (94.6%, a difference of 0.0%), Immigrants from Eastern Asia (94.6%, a difference of 0.010%), Immigrants from Bahamas (94.6%, a difference of 0.010%), and Moroccan (94.6%, a difference of 0.010%).
| Demographics | Rating | Rank | 9th Grade |
| Paraguayans | 30.1 /100 | #193 | Fair 94.7% |
| Panamanians | 29.0 /100 | #194 | Fair 94.7% |
| Marshallese | 27.9 /100 | #195 | Fair 94.7% |
| Immigrants | Lebanon | 27.2 /100 | #196 | Fair 94.7% |
| Immigrants | Micronesia | 24.7 /100 | #197 | Fair 94.7% |
| Hawaiians | 22.7 /100 | #198 | Fair 94.7% |
| Laotians | 21.0 /100 | #199 | Fair 94.6% |
| Immigrants | Zaire | 20.6 /100 | #200 | Fair 94.6% |
| Blacks/African Americans | 20.5 /100 | #201 | Fair 94.6% |
| Immigrants | Eastern Asia | 19.8 /100 | #202 | Poor 94.6% |
| Immigrants | Bahamas | 19.8 /100 | #203 | Poor 94.6% |
| Moroccans | 19.6 /100 | #204 | Poor 94.6% |
| Immigrants | Sudan | 17.6 /100 | #205 | Poor 94.6% |
| Samoans | 17.3 /100 | #206 | Poor 94.6% |
| Immigrants | Morocco | 16.3 /100 | #207 | Poor 94.6% |
Demographics Similar to Basques by 9th Grade
In terms of 9th grade, the demographic groups most similar to Basques are Immigrants from Hungary (95.4%, a difference of 0.0%), Immigrants from Serbia (95.4%, a difference of 0.010%), Palestinian (95.4%, a difference of 0.010%), Jordanian (95.3%, a difference of 0.020%), and Immigrants from South Central Asia (95.4%, a difference of 0.030%).
| Demographics | Rating | Rank | 9th Grade |
| Immigrants | Kuwait | 95.5 /100 | #122 | Exceptional 95.4% |
| Kiowa | 95.3 /100 | #123 | Exceptional 95.4% |
| Shoshone | 95.3 /100 | #124 | Exceptional 95.4% |
| Immigrants | South Central Asia | 95.1 /100 | #125 | Exceptional 95.4% |
| Immigrants | Serbia | 94.4 /100 | #126 | Exceptional 95.4% |
| Palestinians | 94.3 /100 | #127 | Exceptional 95.4% |
| Immigrants | Hungary | 94.2 /100 | #128 | Exceptional 95.4% |
| Basques | 94.1 /100 | #129 | Exceptional 95.4% |
| Jordanians | 93.5 /100 | #130 | Exceptional 95.3% |
| Immigrants | North Macedonia | 92.3 /100 | #131 | Exceptional 95.3% |
| Immigrants | Nonimmigrants | 92.0 /100 | #132 | Exceptional 95.3% |
| Israelis | 90.4 /100 | #133 | Exceptional 95.3% |
| Immigrants | Israel | 89.6 /100 | #134 | Excellent 95.3% |
| Immigrants | Belarus | 88.9 /100 | #135 | Excellent 95.2% |
| Immigrants | Iran | 88.3 /100 | #136 | Excellent 95.2% |