Immigrants from Western Europe vs Immigrants from Cameroon Child Poverty Under the Age of 16
COMPARE
Immigrants from Western Europe
Immigrants from Cameroon
Child Poverty Under the Age of 16
Child Poverty Under the Age of 16 Comparison
Immigrants from Western Europe
Immigrants from Cameroon
15.1%
CHILD POVERTY UNDER THE AGE OF 16
90.3/ 100
METRIC RATING
127th/ 347
METRIC RANK
17.1%
CHILD POVERTY UNDER THE AGE OF 16
14.7/ 100
METRIC RATING
200th/ 347
METRIC RANK
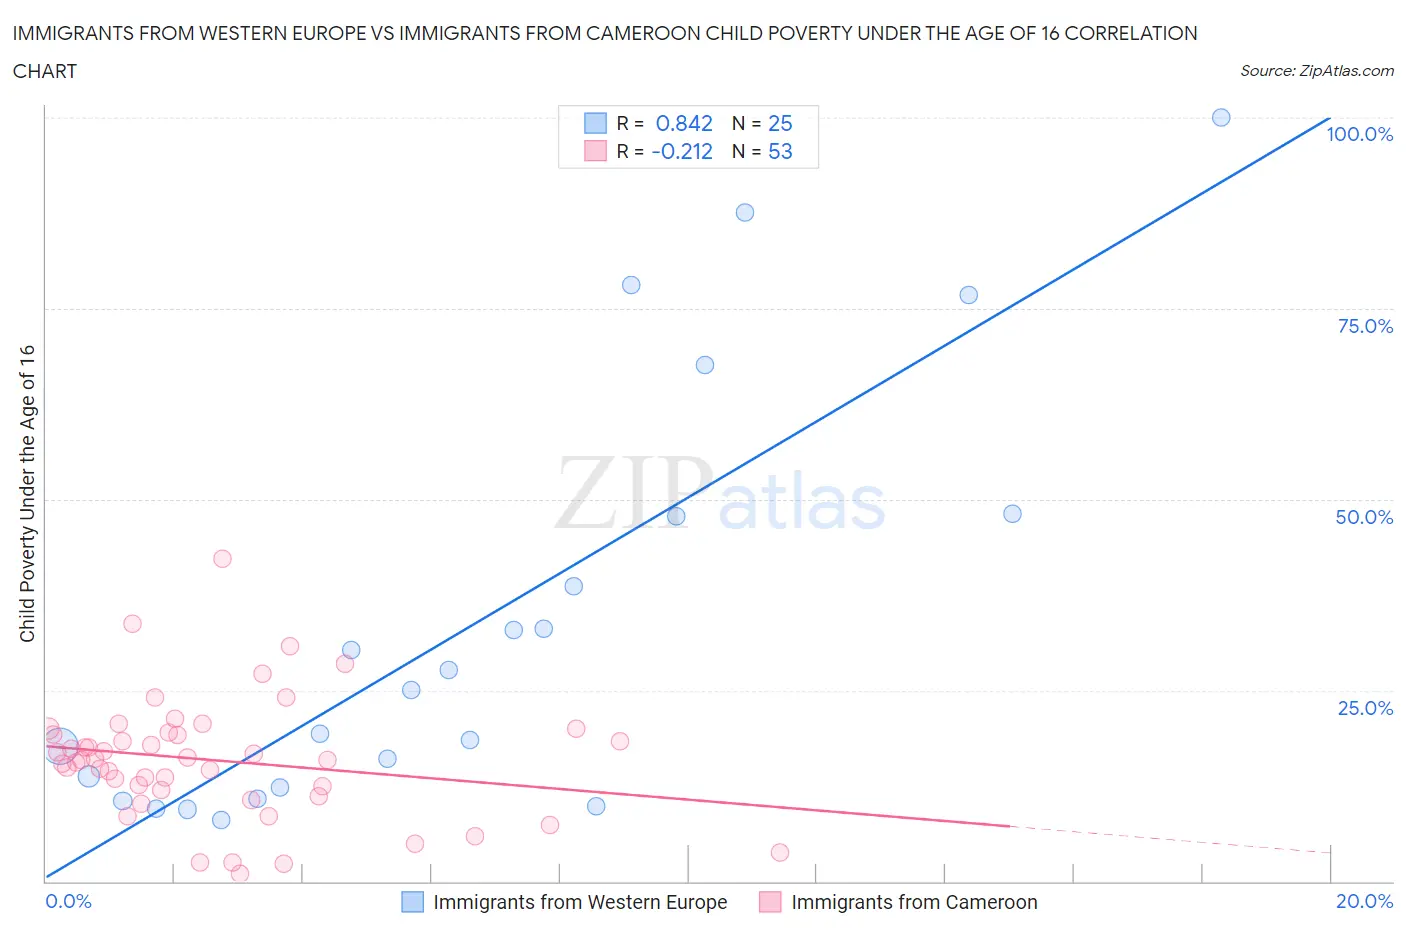
Immigrants from Western Europe vs Immigrants from Cameroon Child Poverty Under the Age of 16 Correlation Chart
The statistical analysis conducted on geographies consisting of 486,953,349 people shows a very strong positive correlation between the proportion of Immigrants from Western Europe and poverty level among children under the age of 16 in the United States with a correlation coefficient (R) of 0.842 and weighted average of 15.1%. Similarly, the statistical analysis conducted on geographies consisting of 130,547,107 people shows a weak negative correlation between the proportion of Immigrants from Cameroon and poverty level among children under the age of 16 in the United States with a correlation coefficient (R) of -0.212 and weighted average of 17.1%, a difference of 12.8%.
Child Poverty Under the Age of 16 Correlation Summary
| Measurement | Immigrants from Western Europe | Immigrants from Cameroon |
| Minimum | 8.0% | 0.90% |
| Maximum | 100.0% | 42.2% |
| Range | 92.0% | 41.3% |
| Mean | 34.0% | 15.8% |
| Median | 25.1% | 15.9% |
| Interquartile 25% (IQ1) | 11.5% | 11.5% |
| Interquartile 75% (IQ3) | 47.9% | 19.4% |
| Interquartile Range (IQR) | 36.4% | 7.8% |
| Standard Deviation (Sample) | 27.5% | 8.0% |
| Standard Deviation (Population) | 26.9% | 7.9% |
Similar Demographics by Child Poverty Under the Age of 16
Demographics Similar to Immigrants from Western Europe by Child Poverty Under the Age of 16
In terms of child poverty under the age of 16, the demographic groups most similar to Immigrants from Western Europe are Immigrants from Kazakhstan (15.1%, a difference of 0.060%), Portuguese (15.1%, a difference of 0.090%), Immigrants from Southern Europe (15.1%, a difference of 0.21%), Palestinian (15.1%, a difference of 0.23%), and Czechoslovakian (15.1%, a difference of 0.27%).
| Demographics | Rating | Rank | Child Poverty Under the Age of 16 |
| South Africans | 92.1 /100 | #120 | Exceptional 15.0% |
| Immigrants | Zimbabwe | 92.1 /100 | #121 | Exceptional 15.0% |
| Pakistanis | 91.7 /100 | #122 | Exceptional 15.0% |
| Immigrants | Brazil | 91.1 /100 | #123 | Exceptional 15.1% |
| Czechoslovakians | 91.0 /100 | #124 | Exceptional 15.1% |
| Palestinians | 90.9 /100 | #125 | Exceptional 15.1% |
| Portuguese | 90.6 /100 | #126 | Exceptional 15.1% |
| Immigrants | Western Europe | 90.3 /100 | #127 | Exceptional 15.1% |
| Immigrants | Kazakhstan | 90.2 /100 | #128 | Exceptional 15.1% |
| Immigrants | Southern Europe | 89.7 /100 | #129 | Excellent 15.1% |
| Mongolians | 89.5 /100 | #130 | Excellent 15.2% |
| Armenians | 89.4 /100 | #131 | Excellent 15.2% |
| Canadians | 89.1 /100 | #132 | Excellent 15.2% |
| Immigrants | South Eastern Asia | 89.0 /100 | #133 | Excellent 15.2% |
| Native Hawaiians | 88.7 /100 | #134 | Excellent 15.2% |
Demographics Similar to Immigrants from Cameroon by Child Poverty Under the Age of 16
In terms of child poverty under the age of 16, the demographic groups most similar to Immigrants from Cameroon are Immigrants from Uzbekistan (17.1%, a difference of 0.010%), Ugandan (17.1%, a difference of 0.090%), Immigrants from Afghanistan (17.0%, a difference of 0.10%), Immigrants from Sierra Leone (17.1%, a difference of 0.11%), and Hmong (17.1%, a difference of 0.17%).
| Demographics | Rating | Rank | Child Poverty Under the Age of 16 |
| Spaniards | 23.2 /100 | #193 | Fair 16.8% |
| Immigrants | Uruguay | 23.1 /100 | #194 | Fair 16.8% |
| Immigrants | Uganda | 22.5 /100 | #195 | Fair 16.8% |
| Immigrants | Lebanon | 22.0 /100 | #196 | Fair 16.8% |
| Immigrants | Kenya | 19.1 /100 | #197 | Poor 16.9% |
| Delaware | 17.1 /100 | #198 | Poor 17.0% |
| Immigrants | Afghanistan | 15.1 /100 | #199 | Poor 17.0% |
| Immigrants | Cameroon | 14.7 /100 | #200 | Poor 17.1% |
| Immigrants | Uzbekistan | 14.7 /100 | #201 | Poor 17.1% |
| Ugandans | 14.3 /100 | #202 | Poor 17.1% |
| Immigrants | Sierra Leone | 14.2 /100 | #203 | Poor 17.1% |
| Hmong | 14.0 /100 | #204 | Poor 17.1% |
| Aleuts | 13.9 /100 | #205 | Poor 17.1% |
| Alaska Natives | 11.8 /100 | #206 | Poor 17.2% |
| German Russians | 8.6 /100 | #207 | Tragic 17.4% |