Immigrants from Western Europe vs Slovene Child Poverty Under the Age of 16
COMPARE
Immigrants from Western Europe
Slovene
Child Poverty Under the Age of 16
Child Poverty Under the Age of 16 Comparison
Immigrants from Western Europe
Slovenes
15.1%
CHILD POVERTY UNDER THE AGE OF 16
90.3/ 100
METRIC RATING
127th/ 347
METRIC RANK
14.3%
CHILD POVERTY UNDER THE AGE OF 16
98.1/ 100
METRIC RATING
66th/ 347
METRIC RANK
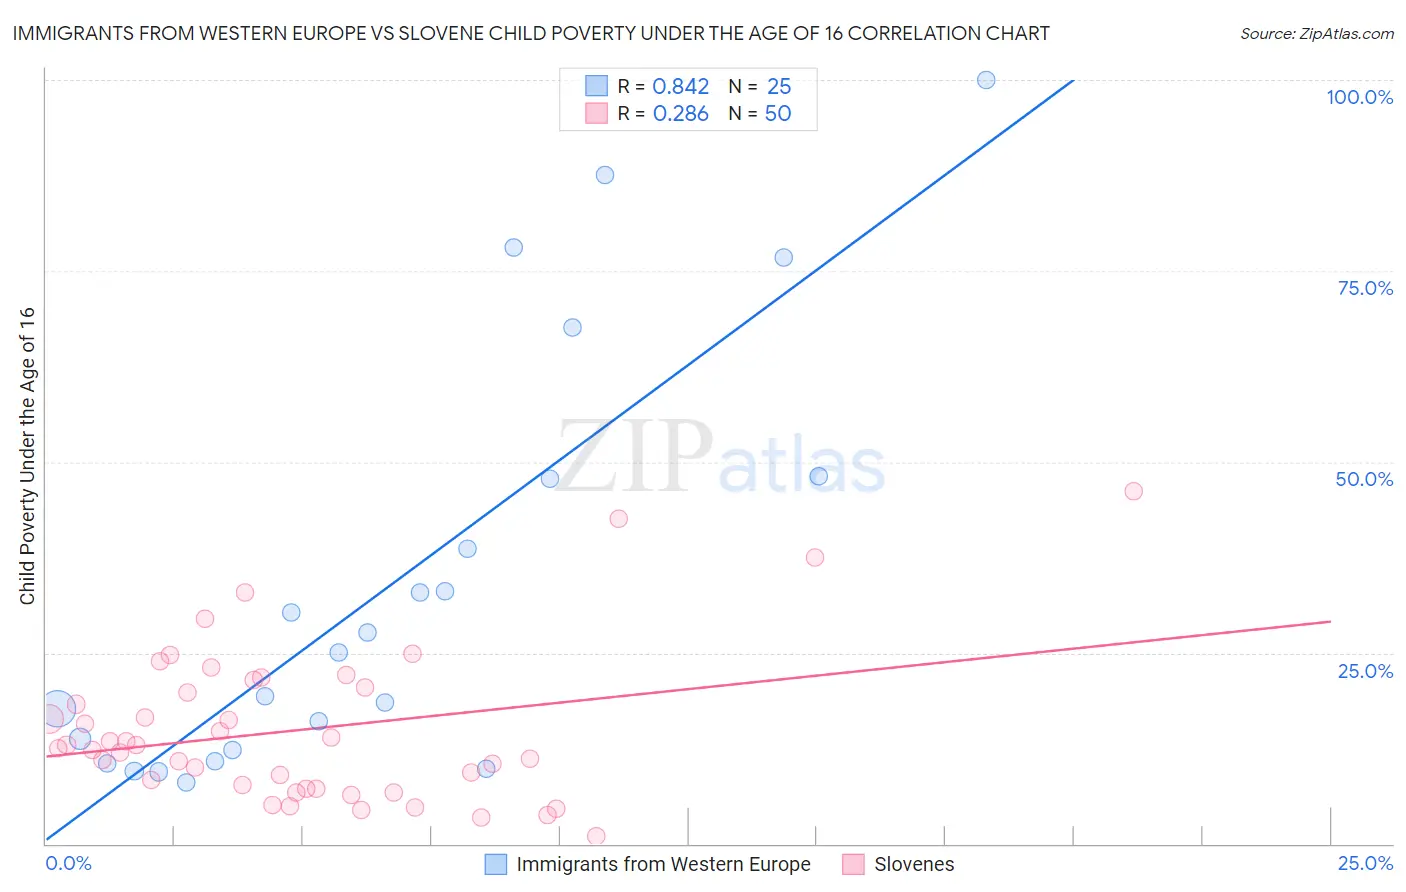
Immigrants from Western Europe vs Slovene Child Poverty Under the Age of 16 Correlation Chart
The statistical analysis conducted on geographies consisting of 486,953,349 people shows a very strong positive correlation between the proportion of Immigrants from Western Europe and poverty level among children under the age of 16 in the United States with a correlation coefficient (R) of 0.842 and weighted average of 15.1%. Similarly, the statistical analysis conducted on geographies consisting of 259,334,026 people shows a weak positive correlation between the proportion of Slovenes and poverty level among children under the age of 16 in the United States with a correlation coefficient (R) of 0.286 and weighted average of 14.3%, a difference of 5.8%.
Child Poverty Under the Age of 16 Correlation Summary
| Measurement | Immigrants from Western Europe | Slovene |
| Minimum | 8.0% | 1.00% |
| Maximum | 100.0% | 46.2% |
| Range | 92.0% | 45.2% |
| Mean | 34.0% | 14.9% |
| Median | 25.1% | 12.7% |
| Interquartile 25% (IQ1) | 11.5% | 7.2% |
| Interquartile 75% (IQ3) | 47.9% | 20.4% |
| Interquartile Range (IQR) | 36.4% | 13.2% |
| Standard Deviation (Sample) | 27.5% | 10.0% |
| Standard Deviation (Population) | 26.9% | 9.9% |
Similar Demographics by Child Poverty Under the Age of 16
Demographics Similar to Immigrants from Western Europe by Child Poverty Under the Age of 16
In terms of child poverty under the age of 16, the demographic groups most similar to Immigrants from Western Europe are Immigrants from Kazakhstan (15.1%, a difference of 0.060%), Portuguese (15.1%, a difference of 0.090%), Immigrants from Southern Europe (15.1%, a difference of 0.21%), Palestinian (15.1%, a difference of 0.23%), and Czechoslovakian (15.1%, a difference of 0.27%).
| Demographics | Rating | Rank | Child Poverty Under the Age of 16 |
| South Africans | 92.1 /100 | #120 | Exceptional 15.0% |
| Immigrants | Zimbabwe | 92.1 /100 | #121 | Exceptional 15.0% |
| Pakistanis | 91.7 /100 | #122 | Exceptional 15.0% |
| Immigrants | Brazil | 91.1 /100 | #123 | Exceptional 15.1% |
| Czechoslovakians | 91.0 /100 | #124 | Exceptional 15.1% |
| Palestinians | 90.9 /100 | #125 | Exceptional 15.1% |
| Portuguese | 90.6 /100 | #126 | Exceptional 15.1% |
| Immigrants | Western Europe | 90.3 /100 | #127 | Exceptional 15.1% |
| Immigrants | Kazakhstan | 90.2 /100 | #128 | Exceptional 15.1% |
| Immigrants | Southern Europe | 89.7 /100 | #129 | Excellent 15.1% |
| Mongolians | 89.5 /100 | #130 | Excellent 15.2% |
| Armenians | 89.4 /100 | #131 | Excellent 15.2% |
| Canadians | 89.1 /100 | #132 | Excellent 15.2% |
| Immigrants | South Eastern Asia | 89.0 /100 | #133 | Excellent 15.2% |
| Native Hawaiians | 88.7 /100 | #134 | Excellent 15.2% |
Demographics Similar to Slovenes by Child Poverty Under the Age of 16
In terms of child poverty under the age of 16, the demographic groups most similar to Slovenes are European (14.3%, a difference of 0.030%), Laotian (14.3%, a difference of 0.14%), Immigrants from Philippines (14.3%, a difference of 0.18%), Immigrants from Bulgaria (14.3%, a difference of 0.21%), and Immigrants from Netherlands (14.3%, a difference of 0.31%).
| Demographics | Rating | Rank | Child Poverty Under the Age of 16 |
| Scandinavians | 98.6 /100 | #59 | Exceptional 14.1% |
| Immigrants | Austria | 98.5 /100 | #60 | Exceptional 14.2% |
| Immigrants | Sweden | 98.5 /100 | #61 | Exceptional 14.2% |
| Zimbabweans | 98.5 /100 | #62 | Exceptional 14.2% |
| Immigrants | Europe | 98.4 /100 | #63 | Exceptional 14.2% |
| Immigrants | Romania | 98.3 /100 | #64 | Exceptional 14.2% |
| Immigrants | Philippines | 98.2 /100 | #65 | Exceptional 14.3% |
| Slovenes | 98.1 /100 | #66 | Exceptional 14.3% |
| Europeans | 98.1 /100 | #67 | Exceptional 14.3% |
| Laotians | 98.0 /100 | #68 | Exceptional 14.3% |
| Immigrants | Bulgaria | 98.0 /100 | #69 | Exceptional 14.3% |
| Immigrants | Netherlands | 97.9 /100 | #70 | Exceptional 14.3% |
| Immigrants | Poland | 97.9 /100 | #71 | Exceptional 14.3% |
| Cambodians | 97.8 /100 | #72 | Exceptional 14.4% |
| Immigrants | Turkey | 97.6 /100 | #73 | Exceptional 14.4% |