Immigrants from Vietnam vs Immigrants from Czechoslovakia Unemployment Among Women with Children Under 6 years
COMPARE
Immigrants from Vietnam
Immigrants from Czechoslovakia
Unemployment Among Women with Children Under 6 years
Unemployment Among Women with Children Under 6 years Comparison
Immigrants from Vietnam
Immigrants from Czechoslovakia
6.6%
UNEMPLOYMENT AMONG WOMEN WITH CHILDREN UNDER 6 YEARS
100.0/ 100
METRIC RATING
33rd/ 347
METRIC RANK
7.0%
UNEMPLOYMENT AMONG WOMEN WITH CHILDREN UNDER 6 YEARS
99.2/ 100
METRIC RATING
73rd/ 347
METRIC RANK
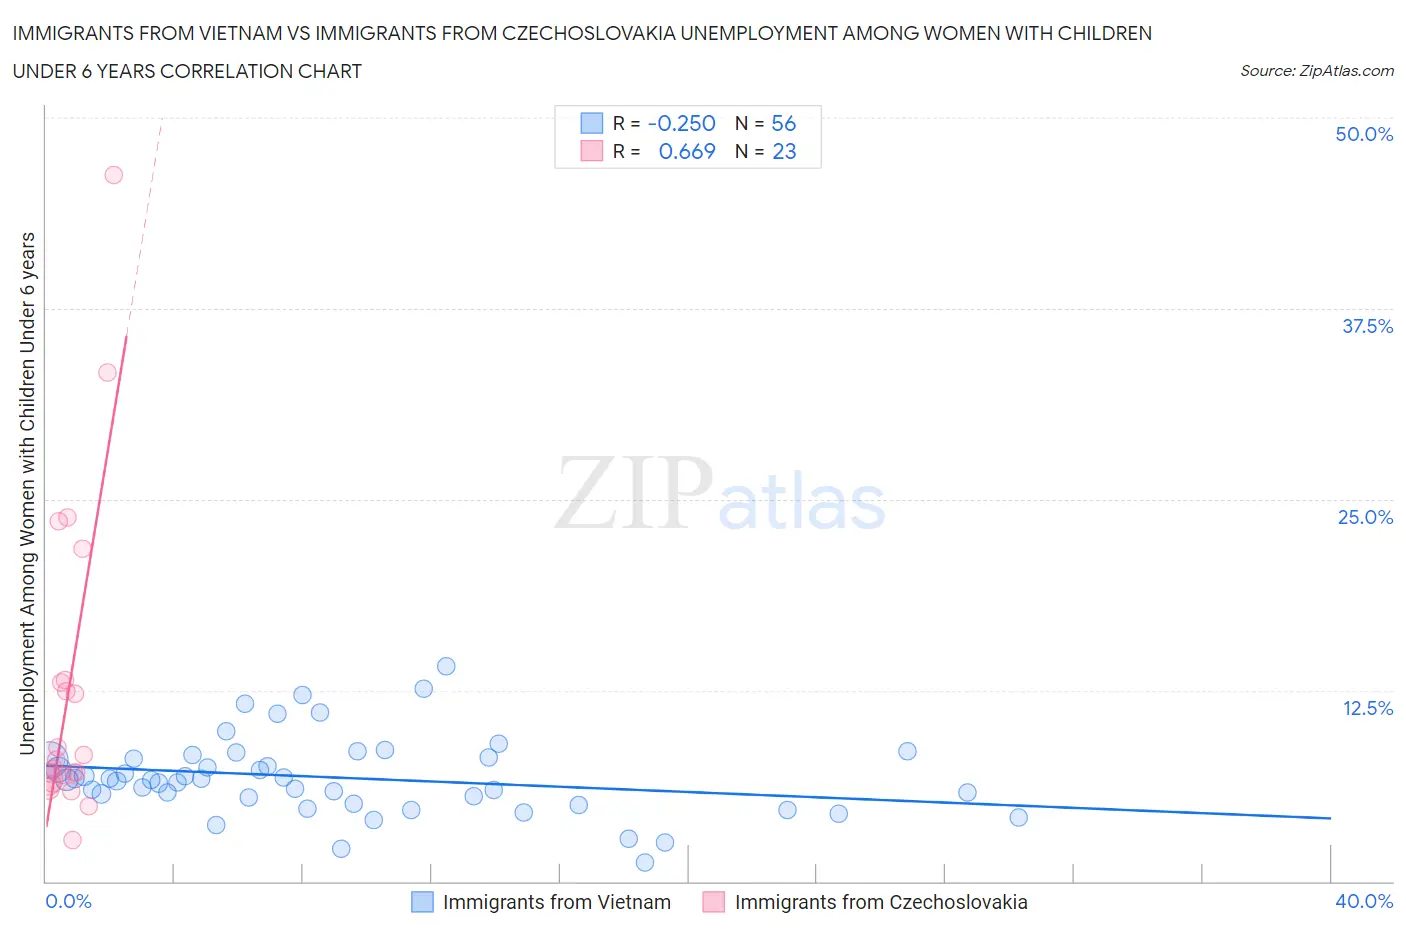
Immigrants from Vietnam vs Immigrants from Czechoslovakia Unemployment Among Women with Children Under 6 years Correlation Chart
The statistical analysis conducted on geographies consisting of 310,532,392 people shows a weak negative correlation between the proportion of Immigrants from Vietnam and unemployment rate among women with children under the age of 6 in the United States with a correlation coefficient (R) of -0.250 and weighted average of 6.6%. Similarly, the statistical analysis conducted on geographies consisting of 163,653,873 people shows a significant positive correlation between the proportion of Immigrants from Czechoslovakia and unemployment rate among women with children under the age of 6 in the United States with a correlation coefficient (R) of 0.669 and weighted average of 7.0%, a difference of 6.5%.
Unemployment Among Women with Children Under 6 years Correlation Summary
| Measurement | Immigrants from Vietnam | Immigrants from Czechoslovakia |
| Minimum | 1.2% | 2.7% |
| Maximum | 14.1% | 46.2% |
| Range | 12.9% | 43.5% |
| Mean | 6.8% | 12.7% |
| Median | 6.6% | 8.0% |
| Interquartile 25% (IQ1) | 5.3% | 6.6% |
| Interquartile 75% (IQ3) | 8.1% | 13.2% |
| Interquartile Range (IQR) | 2.8% | 6.5% |
| Standard Deviation (Sample) | 2.6% | 10.5% |
| Standard Deviation (Population) | 2.5% | 10.2% |
Similar Demographics by Unemployment Among Women with Children Under 6 years
Demographics Similar to Immigrants from Vietnam by Unemployment Among Women with Children Under 6 years
In terms of unemployment among women with children under 6 years, the demographic groups most similar to Immigrants from Vietnam are Immigrants from South Central Asia (6.6%, a difference of 0.010%), Tsimshian (6.6%, a difference of 0.020%), Immigrants from Moldova (6.6%, a difference of 0.080%), Yakama (6.6%, a difference of 0.28%), and Luxembourger (6.6%, a difference of 0.34%).
| Demographics | Rating | Rank | Unemployment Among Women with Children Under 6 years |
| Cypriots | 100.0 /100 | #26 | Exceptional 6.5% |
| Immigrants | Japan | 100.0 /100 | #27 | Exceptional 6.5% |
| Immigrants | Israel | 100.0 /100 | #28 | Exceptional 6.5% |
| Immigrants | Sweden | 100.0 /100 | #29 | Exceptional 6.6% |
| Immigrants | Belarus | 100.0 /100 | #30 | Exceptional 6.6% |
| Immigrants | Moldova | 100.0 /100 | #31 | Exceptional 6.6% |
| Tsimshian | 100.0 /100 | #32 | Exceptional 6.6% |
| Immigrants | Vietnam | 100.0 /100 | #33 | Exceptional 6.6% |
| Immigrants | South Central Asia | 100.0 /100 | #34 | Exceptional 6.6% |
| Yakama | 100.0 /100 | #35 | Exceptional 6.6% |
| Luxembourgers | 100.0 /100 | #36 | Exceptional 6.6% |
| Sri Lankans | 100.0 /100 | #37 | Exceptional 6.6% |
| Hmong | 100.0 /100 | #38 | Exceptional 6.7% |
| Immigrants | Russia | 100.0 /100 | #39 | Exceptional 6.7% |
| Asians | 100.0 /100 | #40 | Exceptional 6.7% |
Demographics Similar to Immigrants from Czechoslovakia by Unemployment Among Women with Children Under 6 years
In terms of unemployment among women with children under 6 years, the demographic groups most similar to Immigrants from Czechoslovakia are Turkish (7.0%, a difference of 0.010%), Immigrants from Eastern Europe (7.1%, a difference of 0.40%), Estonian (7.1%, a difference of 0.45%), Immigrants from Croatia (7.1%, a difference of 0.49%), and Cuban (7.0%, a difference of 0.52%).
| Demographics | Rating | Rank | Unemployment Among Women with Children Under 6 years |
| Immigrants | Belgium | 99.6 /100 | #66 | Exceptional 6.9% |
| Immigrants | Netherlands | 99.5 /100 | #67 | Exceptional 7.0% |
| Paraguayans | 99.4 /100 | #68 | Exceptional 7.0% |
| Immigrants | Eritrea | 99.4 /100 | #69 | Exceptional 7.0% |
| Immigrants | Iraq | 99.4 /100 | #70 | Exceptional 7.0% |
| Afghans | 99.4 /100 | #71 | Exceptional 7.0% |
| Cubans | 99.4 /100 | #72 | Exceptional 7.0% |
| Immigrants | Czechoslovakia | 99.2 /100 | #73 | Exceptional 7.0% |
| Turks | 99.2 /100 | #74 | Exceptional 7.0% |
| Immigrants | Eastern Europe | 99.0 /100 | #75 | Exceptional 7.1% |
| Estonians | 99.0 /100 | #76 | Exceptional 7.1% |
| Immigrants | Croatia | 98.9 /100 | #77 | Exceptional 7.1% |
| Immigrants | Somalia | 98.9 /100 | #78 | Exceptional 7.1% |
| Immigrants | Fiji | 98.9 /100 | #79 | Exceptional 7.1% |
| Immigrants | Greece | 98.9 /100 | #80 | Exceptional 7.1% |