Immigrants from Uzbekistan vs Immigrants from Poland Kindergarten
COMPARE
Immigrants from Uzbekistan
Immigrants from Poland
Kindergarten
Kindergarten Comparison
Immigrants from Uzbekistan
Immigrants from Poland
97.4%
KINDERGARTEN
0.1/ 100
METRIC RATING
278th/ 347
METRIC RANK
97.9%
KINDERGARTEN
41.4/ 100
METRIC RATING
183rd/ 347
METRIC RANK
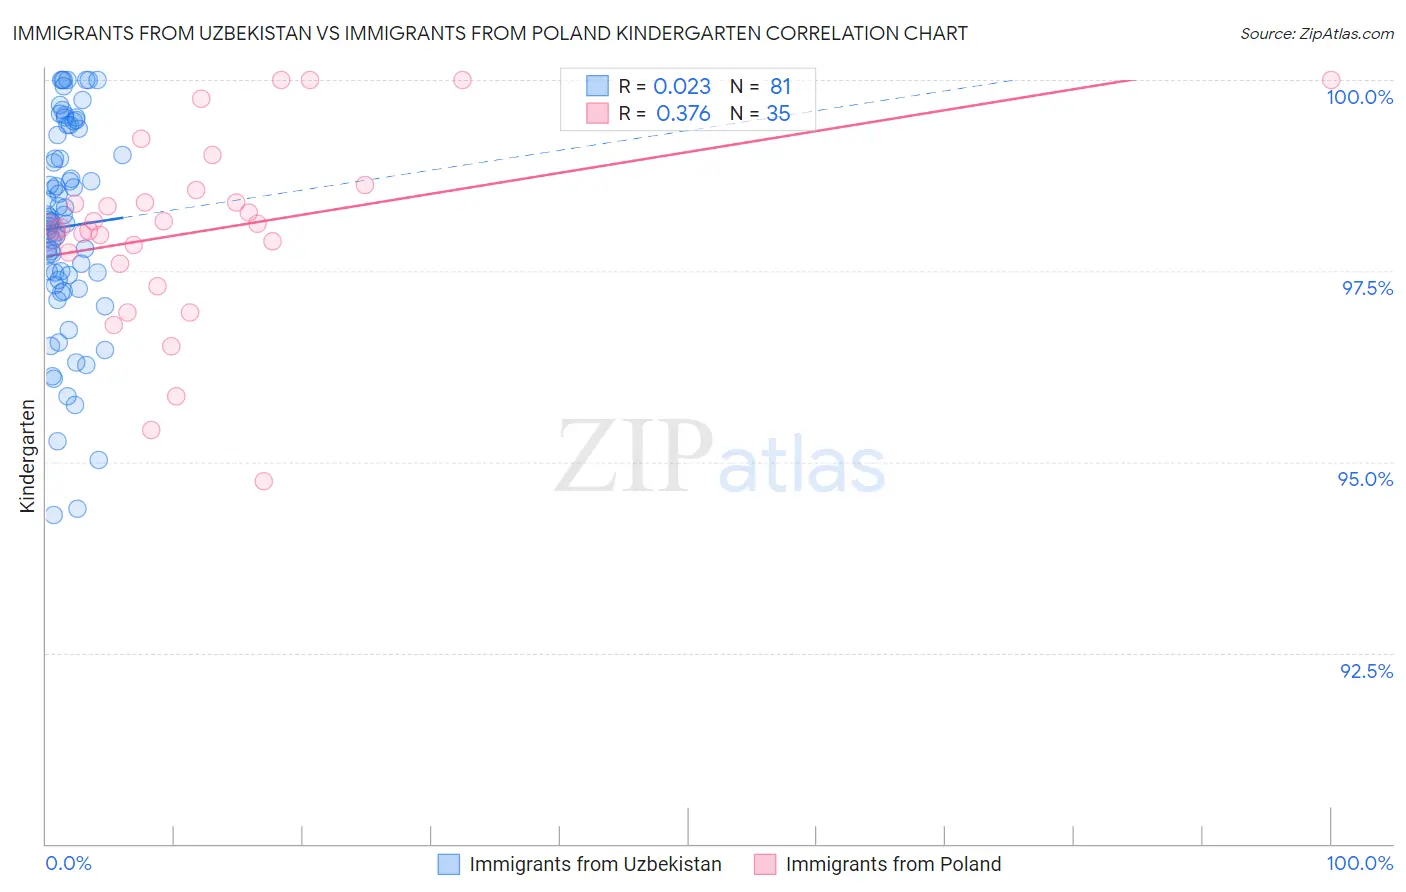
Immigrants from Uzbekistan vs Immigrants from Poland Kindergarten Correlation Chart
The statistical analysis conducted on geographies consisting of 118,593,934 people shows no correlation between the proportion of Immigrants from Uzbekistan and percentage of population with at least kindergarten education in the United States with a correlation coefficient (R) of 0.023 and weighted average of 97.4%. Similarly, the statistical analysis conducted on geographies consisting of 304,861,559 people shows a mild positive correlation between the proportion of Immigrants from Poland and percentage of population with at least kindergarten education in the United States with a correlation coefficient (R) of 0.376 and weighted average of 97.9%, a difference of 0.54%.
Kindergarten Correlation Summary
| Measurement | Immigrants from Uzbekistan | Immigrants from Poland |
| Minimum | 94.3% | 94.8% |
| Maximum | 100.0% | 100.0% |
| Range | 5.7% | 5.2% |
| Mean | 98.1% | 98.0% |
| Median | 98.1% | 98.1% |
| Interquartile 25% (IQ1) | 97.3% | 97.6% |
| Interquartile 75% (IQ3) | 99.3% | 98.6% |
| Interquartile Range (IQR) | 2.0% | 0.97% |
| Standard Deviation (Sample) | 1.4% | 1.2% |
| Standard Deviation (Population) | 1.4% | 1.2% |
Similar Demographics by Kindergarten
Demographics Similar to Immigrants from Uzbekistan by Kindergarten
In terms of kindergarten, the demographic groups most similar to Immigrants from Uzbekistan are Immigrants from Ghana (97.4%, a difference of 0.010%), Barbadian (97.4%, a difference of 0.010%), Trinidadian and Tobagonian (97.4%, a difference of 0.010%), Immigrants from Western Africa (97.4%, a difference of 0.020%), and Afghan (97.4%, a difference of 0.020%).
| Demographics | Rating | Rank | Kindergarten |
| Immigrants | Peru | 0.2 /100 | #271 | Tragic 97.5% |
| Immigrants | Bolivia | 0.2 /100 | #272 | Tragic 97.5% |
| Immigrants | China | 0.1 /100 | #273 | Tragic 97.4% |
| Immigrants | Cameroon | 0.1 /100 | #274 | Tragic 97.4% |
| Ghanaians | 0.1 /100 | #275 | Tragic 97.4% |
| Immigrants | Philippines | 0.1 /100 | #276 | Tragic 97.4% |
| Immigrants | Western Africa | 0.1 /100 | #277 | Tragic 97.4% |
| Immigrants | Uzbekistan | 0.1 /100 | #278 | Tragic 97.4% |
| Immigrants | Ghana | 0.1 /100 | #279 | Tragic 97.4% |
| Barbadians | 0.1 /100 | #280 | Tragic 97.4% |
| Trinidadians and Tobagonians | 0.1 /100 | #281 | Tragic 97.4% |
| Afghans | 0.0 /100 | #282 | Tragic 97.4% |
| Immigrants | West Indies | 0.0 /100 | #283 | Tragic 97.3% |
| Immigrants | Trinidad and Tobago | 0.0 /100 | #284 | Tragic 97.3% |
| Immigrants | Portugal | 0.0 /100 | #285 | Tragic 97.3% |
Demographics Similar to Immigrants from Poland by Kindergarten
In terms of kindergarten, the demographic groups most similar to Immigrants from Poland are Egyptian (97.9%, a difference of 0.0%), Immigrants from Argentina (97.9%, a difference of 0.0%), Portuguese (97.9%, a difference of 0.010%), Immigrants from Belarus (97.9%, a difference of 0.010%), and Albanian (97.9%, a difference of 0.020%).
| Demographics | Rating | Rank | Kindergarten |
| Albanians | 48.5 /100 | #176 | Average 97.9% |
| Immigrants | Venezuela | 47.9 /100 | #177 | Average 97.9% |
| Brazilians | 47.6 /100 | #178 | Average 97.9% |
| Argentineans | 46.8 /100 | #179 | Average 97.9% |
| Immigrants | Bosnia and Herzegovina | 46.7 /100 | #180 | Average 97.9% |
| Portuguese | 43.5 /100 | #181 | Average 97.9% |
| Egyptians | 42.4 /100 | #182 | Average 97.9% |
| Immigrants | Poland | 41.4 /100 | #183 | Average 97.9% |
| Immigrants | Argentina | 40.7 /100 | #184 | Average 97.9% |
| Immigrants | Belarus | 39.4 /100 | #185 | Fair 97.9% |
| Pakistanis | 36.0 /100 | #186 | Fair 97.9% |
| Immigrants | Kazakhstan | 35.9 /100 | #187 | Fair 97.9% |
| Arabs | 35.4 /100 | #188 | Fair 97.9% |
| Paiute | 34.7 /100 | #189 | Fair 97.9% |
| Panamanians | 33.3 /100 | #190 | Fair 97.9% |