Immigrants from Turkey vs Immigrants from Bahamas Female Poverty Among 18-24 Year Olds
COMPARE
Immigrants from Turkey
Immigrants from Bahamas
Female Poverty Among 18-24 Year Olds
Female Poverty Among 18-24 Year Olds Comparison
Immigrants from Turkey
Immigrants from Bahamas
20.5%
FEMALE POVERTY AMONG 18-24 YEAR OLDS
17.7/ 100
METRIC RATING
202nd/ 347
METRIC RANK
21.4%
FEMALE POVERTY AMONG 18-24 YEAR OLDS
0.5/ 100
METRIC RATING
261st/ 347
METRIC RANK
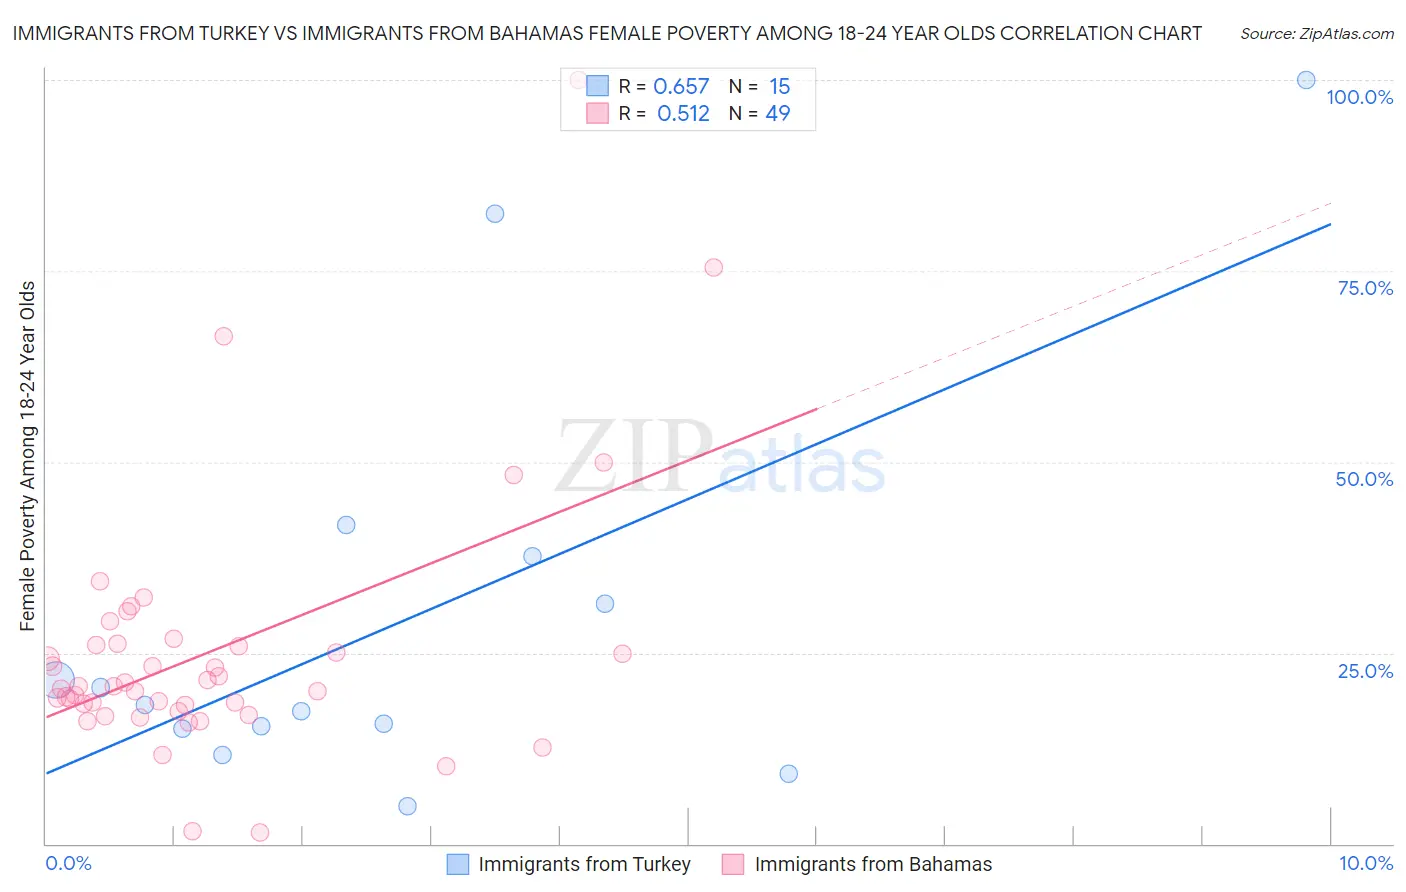
Immigrants from Turkey vs Immigrants from Bahamas Female Poverty Among 18-24 Year Olds Correlation Chart
The statistical analysis conducted on geographies consisting of 219,469,161 people shows a significant positive correlation between the proportion of Immigrants from Turkey and poverty level among females between the ages 18 and 24 in the United States with a correlation coefficient (R) of 0.657 and weighted average of 20.5%. Similarly, the statistical analysis conducted on geographies consisting of 104,259,619 people shows a substantial positive correlation between the proportion of Immigrants from Bahamas and poverty level among females between the ages 18 and 24 in the United States with a correlation coefficient (R) of 0.512 and weighted average of 21.4%, a difference of 4.4%.
Female Poverty Among 18-24 Year Olds Correlation Summary
| Measurement | Immigrants from Turkey | Immigrants from Bahamas |
| Minimum | 5.0% | 1.5% |
| Maximum | 100.0% | 100.0% |
| Range | 95.0% | 98.5% |
| Mean | 29.5% | 25.2% |
| Median | 18.2% | 20.6% |
| Interquartile 25% (IQ1) | 15.0% | 17.7% |
| Interquartile 75% (IQ3) | 37.7% | 26.0% |
| Interquartile Range (IQR) | 22.6% | 8.3% |
| Standard Deviation (Sample) | 27.2% | 17.0% |
| Standard Deviation (Population) | 26.3% | 16.9% |
Similar Demographics by Female Poverty Among 18-24 Year Olds
Demographics Similar to Immigrants from Turkey by Female Poverty Among 18-24 Year Olds
In terms of female poverty among 18-24 year olds, the demographic groups most similar to Immigrants from Turkey are Immigrants from Malaysia (20.5%, a difference of 0.040%), Mexican (20.5%, a difference of 0.050%), Immigrants from Netherlands (20.5%, a difference of 0.060%), English (20.5%, a difference of 0.080%), and Hispanic or Latino (20.5%, a difference of 0.090%).
| Demographics | Rating | Rank | Female Poverty Among 18-24 Year Olds |
| Immigrants | Latvia | 23.0 /100 | #195 | Fair 20.4% |
| Czechs | 22.3 /100 | #196 | Fair 20.4% |
| Zimbabweans | 21.0 /100 | #197 | Fair 20.4% |
| Immigrants | Spain | 20.7 /100 | #198 | Fair 20.4% |
| Germans | 20.6 /100 | #199 | Fair 20.4% |
| Europeans | 19.9 /100 | #200 | Poor 20.4% |
| Mexicans | 18.3 /100 | #201 | Poor 20.5% |
| Immigrants | Turkey | 17.7 /100 | #202 | Poor 20.5% |
| Immigrants | Malaysia | 17.2 /100 | #203 | Poor 20.5% |
| Immigrants | Netherlands | 17.0 /100 | #204 | Poor 20.5% |
| English | 16.7 /100 | #205 | Poor 20.5% |
| Hispanics or Latinos | 16.6 /100 | #206 | Poor 20.5% |
| Spaniards | 16.3 /100 | #207 | Poor 20.5% |
| Dutch | 15.9 /100 | #208 | Poor 20.5% |
| Arabs | 15.5 /100 | #209 | Poor 20.5% |
Demographics Similar to Immigrants from Bahamas by Female Poverty Among 18-24 Year Olds
In terms of female poverty among 18-24 year olds, the demographic groups most similar to Immigrants from Bahamas are Immigrants from Norway (21.4%, a difference of 0.070%), Immigrants from France (21.4%, a difference of 0.12%), Vietnamese (21.4%, a difference of 0.14%), Immigrants from Eastern Africa (21.4%, a difference of 0.20%), and Icelander (21.5%, a difference of 0.55%).
| Demographics | Rating | Rank | Female Poverty Among 18-24 Year Olds |
| British West Indians | 1.2 /100 | #254 | Tragic 21.2% |
| Immigrants | Grenada | 1.2 /100 | #255 | Tragic 21.2% |
| Tsimshian | 1.0 /100 | #256 | Tragic 21.2% |
| Taiwanese | 1.0 /100 | #257 | Tragic 21.2% |
| Vietnamese | 0.6 /100 | #258 | Tragic 21.4% |
| Immigrants | France | 0.6 /100 | #259 | Tragic 21.4% |
| Immigrants | Norway | 0.6 /100 | #260 | Tragic 21.4% |
| Immigrants | Bahamas | 0.5 /100 | #261 | Tragic 21.4% |
| Immigrants | Eastern Africa | 0.4 /100 | #262 | Tragic 21.4% |
| Icelanders | 0.3 /100 | #263 | Tragic 21.5% |
| Hondurans | 0.3 /100 | #264 | Tragic 21.5% |
| Immigrants | Nonimmigrants | 0.3 /100 | #265 | Tragic 21.5% |
| Alaska Natives | 0.3 /100 | #266 | Tragic 21.5% |
| Americans | 0.3 /100 | #267 | Tragic 21.6% |
| Immigrants | Burma/Myanmar | 0.2 /100 | #268 | Tragic 21.6% |