Immigrants from Trinidad and Tobago vs Fijian Child Poverty Among Boys Under 16
COMPARE
Immigrants from Trinidad and Tobago
Fijian
Child Poverty Among Boys Under 16
Child Poverty Among Boys Under 16 Comparison
Immigrants from Trinidad and Tobago
Fijians
19.0%
CHILD POVERTY AMONG BOYS UNDER 16
0.3/ 100
METRIC RATING
247th/ 347
METRIC RANK
18.3%
CHILD POVERTY AMONG BOYS UNDER 16
1.8/ 100
METRIC RATING
230th/ 347
METRIC RANK
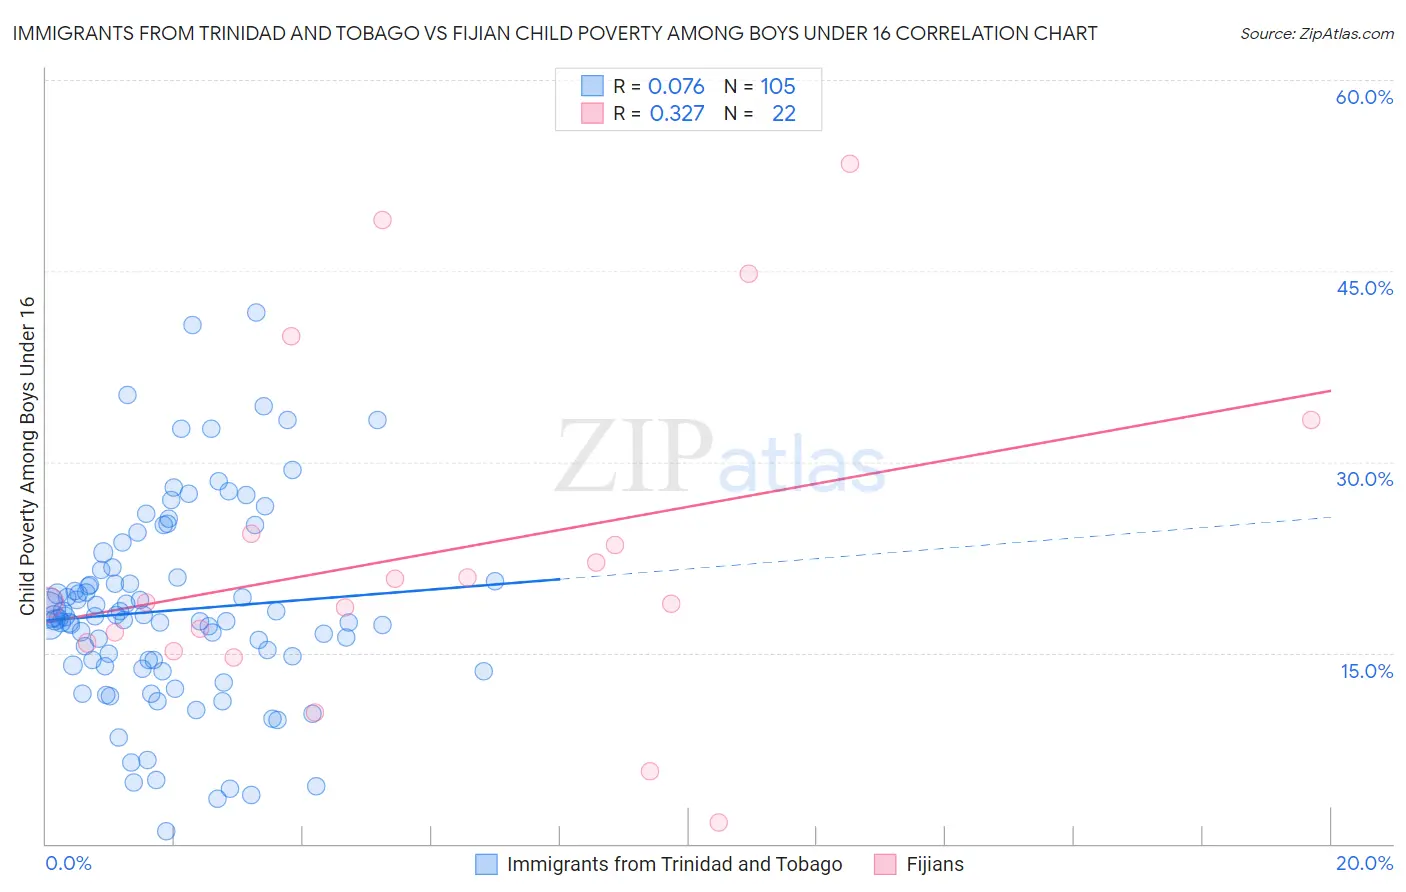
Immigrants from Trinidad and Tobago vs Fijian Child Poverty Among Boys Under 16 Correlation Chart
The statistical analysis conducted on geographies consisting of 221,543,811 people shows a slight positive correlation between the proportion of Immigrants from Trinidad and Tobago and poverty level among boys under the age of 16 in the United States with a correlation coefficient (R) of 0.076 and weighted average of 19.0%. Similarly, the statistical analysis conducted on geographies consisting of 55,842,627 people shows a mild positive correlation between the proportion of Fijians and poverty level among boys under the age of 16 in the United States with a correlation coefficient (R) of 0.327 and weighted average of 18.3%, a difference of 4.1%.
Child Poverty Among Boys Under 16 Correlation Summary
| Measurement | Immigrants from Trinidad and Tobago | Fijian |
| Minimum | 0.94% | 1.7% |
| Maximum | 41.7% | 53.4% |
| Range | 40.8% | 51.7% |
| Mean | 18.3% | 22.9% |
| Median | 17.7% | 19.0% |
| Interquartile 25% (IQ1) | 14.0% | 15.8% |
| Interquartile 75% (IQ3) | 21.2% | 24.4% |
| Interquartile Range (IQR) | 7.2% | 8.6% |
| Standard Deviation (Sample) | 7.8% | 13.3% |
| Standard Deviation (Population) | 7.7% | 13.0% |
Demographics Similar to Immigrants from Trinidad and Tobago and Fijians by Child Poverty Among Boys Under 16
In terms of child poverty among boys under 16, the demographic groups most similar to Immigrants from Trinidad and Tobago are Salvadoran (19.0%, a difference of 0.080%), Immigrants from Nicaragua (19.0%, a difference of 0.12%), Cree (19.0%, a difference of 0.32%), Immigrants from Middle Africa (18.9%, a difference of 0.45%), and Immigrants from the Azores (18.9%, a difference of 0.46%). Similarly, the demographic groups most similar to Fijians are Immigrants from Micronesia (18.3%, a difference of 0.0%), Nonimmigrants (18.2%, a difference of 0.52%), Nicaraguan (18.4%, a difference of 0.53%), Marshallese (18.4%, a difference of 0.73%), and Immigrants from Nigeria (18.4%, a difference of 0.92%).
| Demographics | Rating | Rank | Child Poverty Among Boys Under 16 |
| Immigrants | Nonimmigrants | 2.2 /100 | #228 | Tragic 18.2% |
| Immigrants | Micronesia | 1.8 /100 | #229 | Tragic 18.3% |
| Fijians | 1.8 /100 | #230 | Tragic 18.3% |
| Nicaraguans | 1.4 /100 | #231 | Tragic 18.4% |
| Marshallese | 1.3 /100 | #232 | Tragic 18.4% |
| Immigrants | Nigeria | 1.2 /100 | #233 | Tragic 18.4% |
| Nigerians | 1.1 /100 | #234 | Tragic 18.5% |
| Americans | 0.9 /100 | #235 | Tragic 18.6% |
| Sudanese | 0.9 /100 | #236 | Tragic 18.6% |
| Immigrants | Eritrea | 0.8 /100 | #237 | Tragic 18.6% |
| Immigrants | Laos | 0.8 /100 | #238 | Tragic 18.7% |
| Cape Verdeans | 0.7 /100 | #239 | Tragic 18.7% |
| Immigrants | Cuba | 0.6 /100 | #240 | Tragic 18.8% |
| Immigrants | Sudan | 0.6 /100 | #241 | Tragic 18.8% |
| Ghanaians | 0.5 /100 | #242 | Tragic 18.9% |
| Immigrants | Azores | 0.4 /100 | #243 | Tragic 18.9% |
| Immigrants | Middle Africa | 0.4 /100 | #244 | Tragic 18.9% |
| Cree | 0.4 /100 | #245 | Tragic 19.0% |
| Immigrants | Nicaragua | 0.4 /100 | #246 | Tragic 19.0% |
| Immigrants | Trinidad and Tobago | 0.3 /100 | #247 | Tragic 19.0% |
| Salvadorans | 0.3 /100 | #248 | Tragic 19.0% |