Immigrants from Thailand vs Kenyan Female Poverty
COMPARE
Immigrants from Thailand
Kenyan
Female Poverty
Female Poverty Comparison
Immigrants from Thailand
Kenyans
14.4%
FEMALE POVERTY
4.5/ 100
METRIC RATING
216th/ 347
METRIC RANK
13.5%
FEMALE POVERTY
43.8/ 100
METRIC RATING
183rd/ 347
METRIC RANK
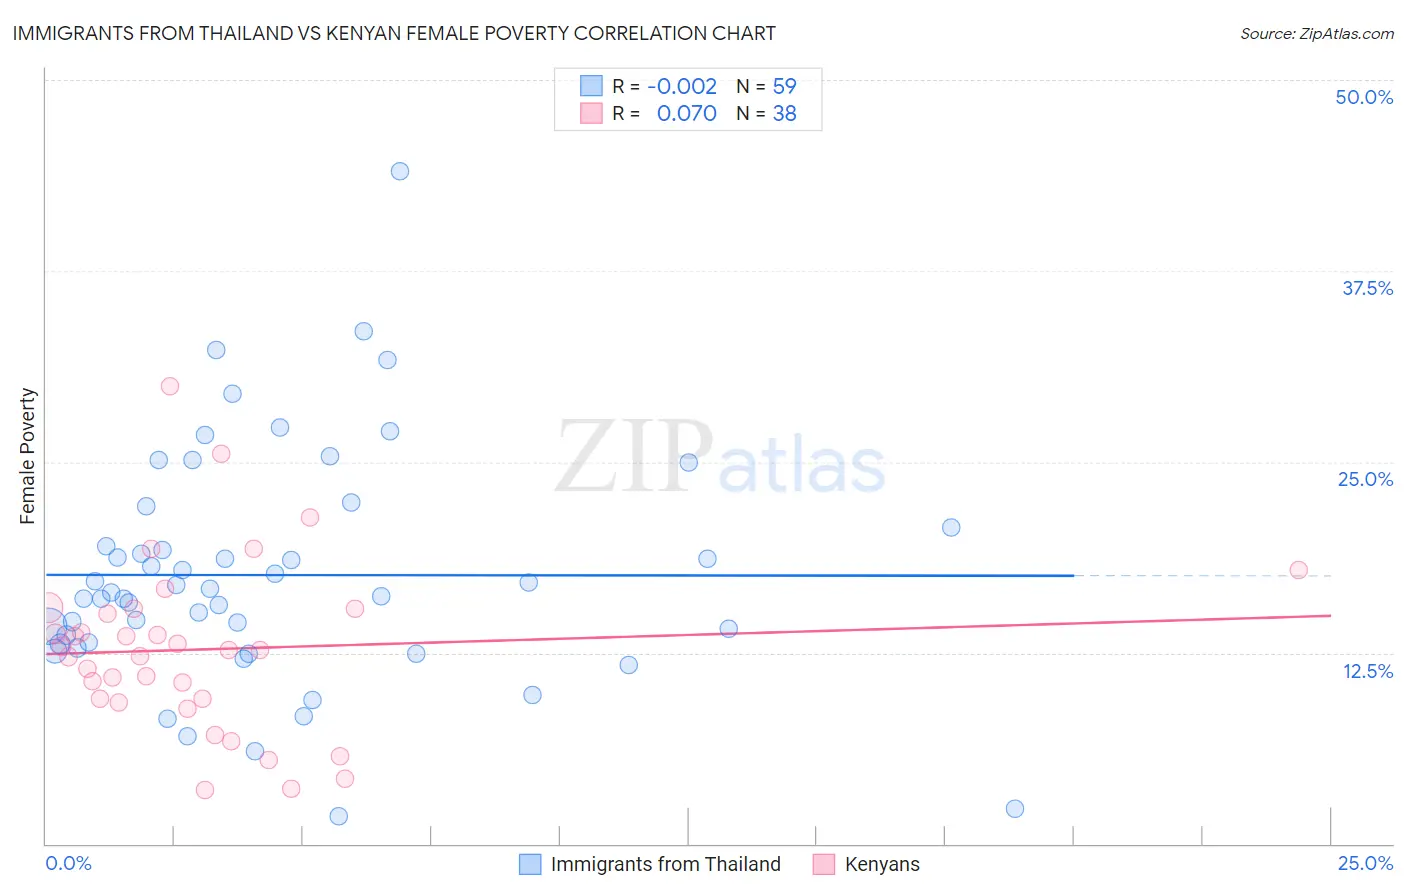
Immigrants from Thailand vs Kenyan Female Poverty Correlation Chart
The statistical analysis conducted on geographies consisting of 316,905,343 people shows no correlation between the proportion of Immigrants from Thailand and poverty level among females in the United States with a correlation coefficient (R) of -0.002 and weighted average of 14.4%. Similarly, the statistical analysis conducted on geographies consisting of 168,133,672 people shows a slight positive correlation between the proportion of Kenyans and poverty level among females in the United States with a correlation coefficient (R) of 0.070 and weighted average of 13.5%, a difference of 6.7%.
Female Poverty Correlation Summary
| Measurement | Immigrants from Thailand | Kenyan |
| Minimum | 1.8% | 3.5% |
| Maximum | 44.1% | 29.9% |
| Range | 42.3% | 26.4% |
| Mean | 17.6% | 12.7% |
| Median | 16.4% | 12.7% |
| Interquartile 25% (IQ1) | 13.1% | 9.5% |
| Interquartile 75% (IQ3) | 20.7% | 15.4% |
| Interquartile Range (IQR) | 7.6% | 5.9% |
| Standard Deviation (Sample) | 7.7% | 5.6% |
| Standard Deviation (Population) | 7.6% | 5.5% |
Similar Demographics by Female Poverty
Demographics Similar to Immigrants from Thailand by Female Poverty
In terms of female poverty, the demographic groups most similar to Immigrants from Thailand are Immigrants (14.4%, a difference of 0.030%), Immigrants from Uzbekistan (14.4%, a difference of 0.080%), Immigrants from Panama (14.4%, a difference of 0.090%), Japanese (14.5%, a difference of 0.22%), and Marshallese (14.4%, a difference of 0.23%).
| Demographics | Rating | Rank | Female Poverty |
| Panamanians | 7.7 /100 | #209 | Tragic 14.2% |
| Malaysians | 7.4 /100 | #210 | Tragic 14.3% |
| Moroccans | 7.2 /100 | #211 | Tragic 14.3% |
| Bermudans | 5.5 /100 | #212 | Tragic 14.4% |
| Alaskan Athabascans | 5.3 /100 | #213 | Tragic 14.4% |
| Marshallese | 5.0 /100 | #214 | Tragic 14.4% |
| Immigrants | Panama | 4.7 /100 | #215 | Tragic 14.4% |
| Immigrants | Thailand | 4.5 /100 | #216 | Tragic 14.4% |
| Immigrants | Immigrants | 4.5 /100 | #217 | Tragic 14.4% |
| Immigrants | Uzbekistan | 4.4 /100 | #218 | Tragic 14.4% |
| Japanese | 4.1 /100 | #219 | Tragic 14.5% |
| Alsatians | 4.0 /100 | #220 | Tragic 14.5% |
| Immigrants | Cambodia | 3.7 /100 | #221 | Tragic 14.5% |
| Immigrants | Nonimmigrants | 3.7 /100 | #222 | Tragic 14.5% |
| Immigrants | Africa | 3.3 /100 | #223 | Tragic 14.5% |
Demographics Similar to Kenyans by Female Poverty
In terms of female poverty, the demographic groups most similar to Kenyans are Immigrants from Sierra Leone (13.5%, a difference of 0.060%), Venezuelan (13.5%, a difference of 0.070%), Immigrants from Colombia (13.5%, a difference of 0.070%), South American (13.5%, a difference of 0.10%), and Immigrants from Cameroon (13.5%, a difference of 0.17%).
| Demographics | Rating | Rank | Female Poverty |
| Immigrants | Spain | 49.9 /100 | #176 | Average 13.4% |
| Immigrants | Morocco | 49.4 /100 | #177 | Average 13.4% |
| Israelis | 49.1 /100 | #178 | Average 13.5% |
| Immigrants | Syria | 48.8 /100 | #179 | Average 13.5% |
| South Americans | 44.8 /100 | #180 | Average 13.5% |
| Venezuelans | 44.5 /100 | #181 | Average 13.5% |
| Immigrants | Colombia | 44.5 /100 | #182 | Average 13.5% |
| Kenyans | 43.8 /100 | #183 | Average 13.5% |
| Immigrants | Sierra Leone | 43.2 /100 | #184 | Average 13.5% |
| Immigrants | Cameroon | 42.0 /100 | #185 | Average 13.5% |
| Immigrants | Portugal | 41.5 /100 | #186 | Average 13.6% |
| Immigrants | Venezuela | 41.0 /100 | #187 | Average 13.6% |
| Hawaiians | 39.9 /100 | #188 | Fair 13.6% |
| Uruguayans | 39.8 /100 | #189 | Fair 13.6% |
| Sierra Leoneans | 33.1 /100 | #190 | Fair 13.7% |