Iraqi vs Kenyan Female Poverty
COMPARE
Iraqi
Kenyan
Female Poverty
Female Poverty Comparison
Iraqis
Kenyans
13.7%
FEMALE POVERTY
31.8/ 100
METRIC RATING
193rd/ 347
METRIC RANK
13.5%
FEMALE POVERTY
43.8/ 100
METRIC RATING
183rd/ 347
METRIC RANK
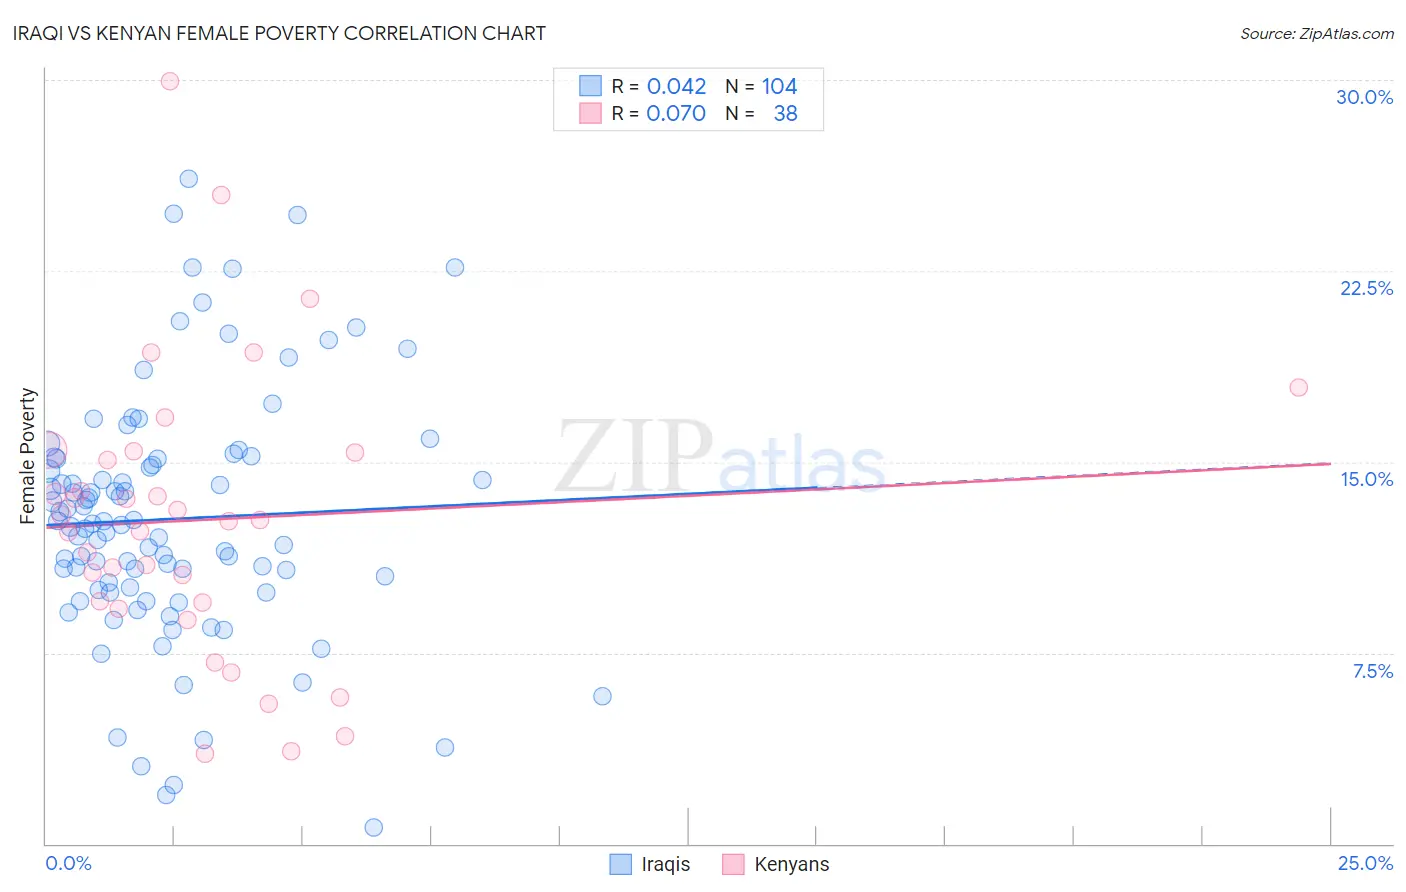
Iraqi vs Kenyan Female Poverty Correlation Chart
The statistical analysis conducted on geographies consisting of 170,556,869 people shows no correlation between the proportion of Iraqis and poverty level among females in the United States with a correlation coefficient (R) of 0.042 and weighted average of 13.7%. Similarly, the statistical analysis conducted on geographies consisting of 168,133,672 people shows a slight positive correlation between the proportion of Kenyans and poverty level among females in the United States with a correlation coefficient (R) of 0.070 and weighted average of 13.5%, a difference of 1.2%.
Female Poverty Correlation Summary
| Measurement | Iraqi | Kenyan |
| Minimum | 0.62% | 3.5% |
| Maximum | 26.1% | 29.9% |
| Range | 25.5% | 26.4% |
| Mean | 12.8% | 12.7% |
| Median | 12.5% | 12.7% |
| Interquartile 25% (IQ1) | 10.0% | 9.5% |
| Interquartile 75% (IQ3) | 15.1% | 15.4% |
| Interquartile Range (IQR) | 5.1% | 5.9% |
| Standard Deviation (Sample) | 4.9% | 5.6% |
| Standard Deviation (Population) | 4.9% | 5.5% |
Demographics Similar to Iraqis and Kenyans by Female Poverty
In terms of female poverty, the demographic groups most similar to Iraqis are Immigrants from Costa Rica (13.7%, a difference of 0.020%), Delaware (13.7%, a difference of 0.070%), Immigrants from Kuwait (13.7%, a difference of 0.10%), Immigrants from South America (13.7%, a difference of 0.12%), and Sierra Leonean (13.7%, a difference of 0.14%). Similarly, the demographic groups most similar to Kenyans are Immigrants from Sierra Leone (13.5%, a difference of 0.060%), Venezuelan (13.5%, a difference of 0.070%), Immigrants from Colombia (13.5%, a difference of 0.070%), South American (13.5%, a difference of 0.10%), and Immigrants from Cameroon (13.5%, a difference of 0.17%).
| Demographics | Rating | Rank | Female Poverty |
| Israelis | 49.1 /100 | #178 | Average 13.5% |
| Immigrants | Syria | 48.8 /100 | #179 | Average 13.5% |
| South Americans | 44.8 /100 | #180 | Average 13.5% |
| Venezuelans | 44.5 /100 | #181 | Average 13.5% |
| Immigrants | Colombia | 44.5 /100 | #182 | Average 13.5% |
| Kenyans | 43.8 /100 | #183 | Average 13.5% |
| Immigrants | Sierra Leone | 43.2 /100 | #184 | Average 13.5% |
| Immigrants | Cameroon | 42.0 /100 | #185 | Average 13.5% |
| Immigrants | Portugal | 41.5 /100 | #186 | Average 13.6% |
| Immigrants | Venezuela | 41.0 /100 | #187 | Average 13.6% |
| Hawaiians | 39.9 /100 | #188 | Fair 13.6% |
| Uruguayans | 39.8 /100 | #189 | Fair 13.6% |
| Sierra Leoneans | 33.1 /100 | #190 | Fair 13.7% |
| Immigrants | Kuwait | 32.7 /100 | #191 | Fair 13.7% |
| Immigrants | Costa Rica | 31.9 /100 | #192 | Fair 13.7% |
| Iraqis | 31.8 /100 | #193 | Fair 13.7% |
| Delaware | 31.1 /100 | #194 | Fair 13.7% |
| Immigrants | South America | 30.6 /100 | #195 | Fair 13.7% |
| South American Indians | 28.9 /100 | #196 | Fair 13.7% |
| Arabs | 28.6 /100 | #197 | Fair 13.7% |
| Immigrants | Uganda | 28.5 /100 | #198 | Fair 13.7% |