Immigrants from Thailand vs Danish Female Poverty Among 25-34 Year Olds
COMPARE
Immigrants from Thailand
Danish
Female Poverty Among 25-34 Year Olds
Female Poverty Among 25-34 Year Olds Comparison
Immigrants from Thailand
Danes
14.3%
FEMALE POVERTY AMONG 25-34 YEAR OLDS
5.2/ 100
METRIC RATING
218th/ 347
METRIC RANK
12.8%
FEMALE POVERTY AMONG 25-34 YEAR OLDS
93.9/ 100
METRIC RATING
111th/ 347
METRIC RANK
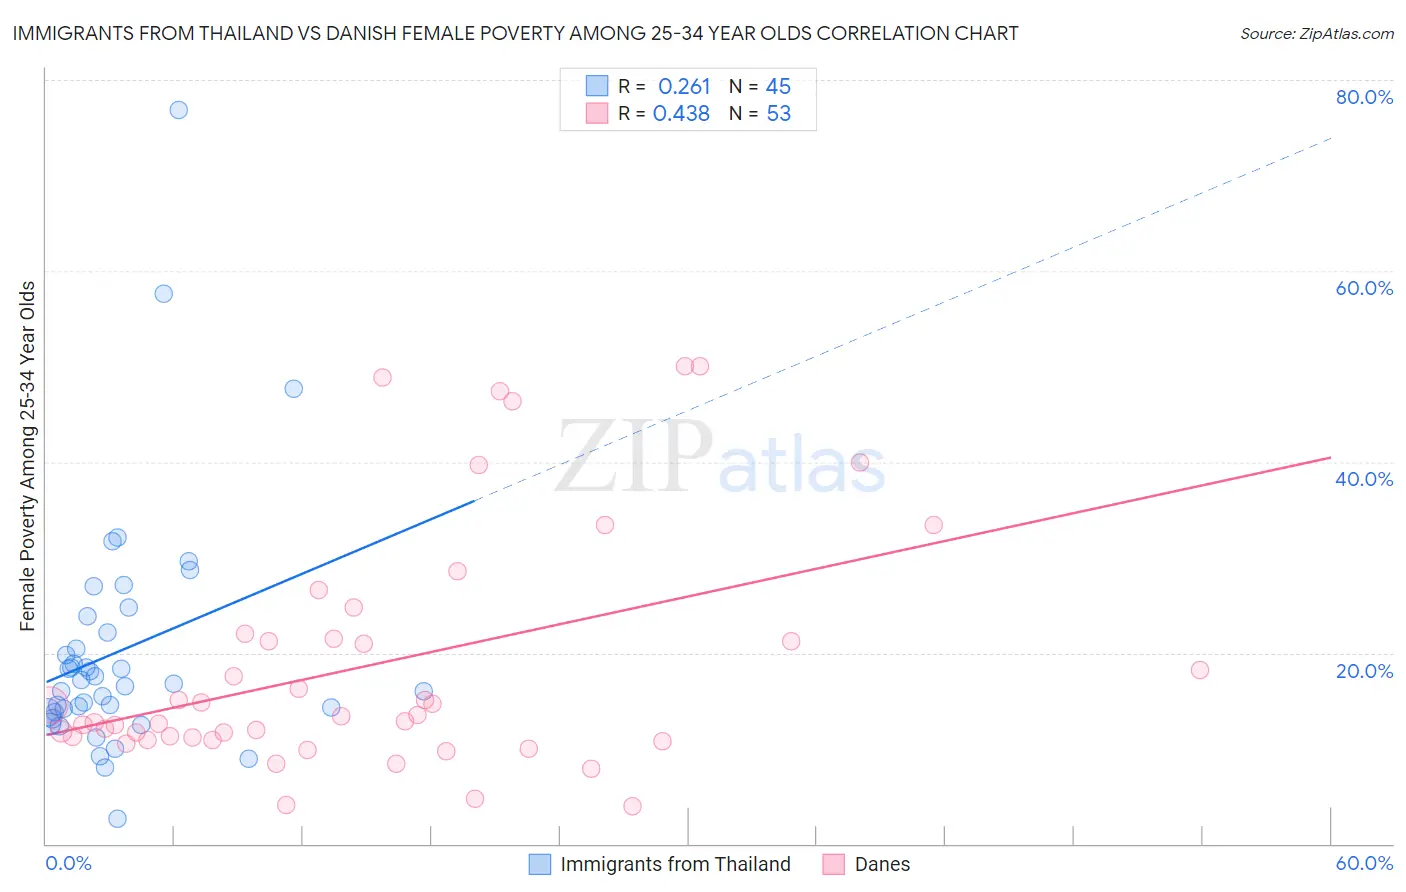
Immigrants from Thailand vs Danish Female Poverty Among 25-34 Year Olds Correlation Chart
The statistical analysis conducted on geographies consisting of 313,866,299 people shows a weak positive correlation between the proportion of Immigrants from Thailand and poverty level among females between the ages 25 and 34 in the United States with a correlation coefficient (R) of 0.261 and weighted average of 14.3%. Similarly, the statistical analysis conducted on geographies consisting of 461,269,939 people shows a moderate positive correlation between the proportion of Danes and poverty level among females between the ages 25 and 34 in the United States with a correlation coefficient (R) of 0.438 and weighted average of 12.8%, a difference of 12.4%.
Female Poverty Among 25-34 Year Olds Correlation Summary
| Measurement | Immigrants from Thailand | Danish |
| Minimum | 2.6% | 3.9% |
| Maximum | 76.9% | 50.0% |
| Range | 74.3% | 46.1% |
| Mean | 20.2% | 18.8% |
| Median | 16.7% | 13.4% |
| Interquartile 25% (IQ1) | 13.8% | 11.0% |
| Interquartile 75% (IQ3) | 23.0% | 21.7% |
| Interquartile Range (IQR) | 9.2% | 10.7% |
| Standard Deviation (Sample) | 13.0% | 12.5% |
| Standard Deviation (Population) | 12.9% | 12.4% |
Similar Demographics by Female Poverty Among 25-34 Year Olds
Demographics Similar to Immigrants from Thailand by Female Poverty Among 25-34 Year Olds
In terms of female poverty among 25-34 year olds, the demographic groups most similar to Immigrants from Thailand are Ecuadorian (14.3%, a difference of 0.0%), French Canadian (14.3%, a difference of 0.11%), Spanish American Indian (14.3%, a difference of 0.11%), Ghanaian (14.4%, a difference of 0.17%), and Sudanese (14.4%, a difference of 0.32%).
| Demographics | Rating | Rank | Female Poverty Among 25-34 Year Olds |
| Trinidadians and Tobagonians | 8.2 /100 | #211 | Tragic 14.2% |
| Immigrants | Guyana | 6.6 /100 | #212 | Tragic 14.3% |
| Puget Sound Salish | 6.5 /100 | #213 | Tragic 14.3% |
| French | 6.2 /100 | #214 | Tragic 14.3% |
| Immigrants | Nigeria | 6.2 /100 | #215 | Tragic 14.3% |
| French Canadians | 5.5 /100 | #216 | Tragic 14.3% |
| Spanish American Indians | 5.5 /100 | #217 | Tragic 14.3% |
| Immigrants | Thailand | 5.2 /100 | #218 | Tragic 14.3% |
| Ecuadorians | 5.2 /100 | #219 | Tragic 14.3% |
| Ghanaians | 4.8 /100 | #220 | Tragic 14.4% |
| Sudanese | 4.4 /100 | #221 | Tragic 14.4% |
| Immigrants | Portugal | 4.3 /100 | #222 | Tragic 14.4% |
| Nigerians | 4.2 /100 | #223 | Tragic 14.4% |
| Immigrants | Sudan | 4.0 /100 | #224 | Tragic 14.4% |
| Immigrants | Barbados | 3.4 /100 | #225 | Tragic 14.5% |
Demographics Similar to Danes by Female Poverty Among 25-34 Year Olds
In terms of female poverty among 25-34 year olds, the demographic groups most similar to Danes are Immigrants from Morocco (12.8%, a difference of 0.020%), Immigrants from Syria (12.8%, a difference of 0.060%), Australian (12.8%, a difference of 0.070%), Immigrants from Southern Europe (12.8%, a difference of 0.13%), and Immigrants from Peru (12.7%, a difference of 0.15%).
| Demographics | Rating | Rank | Female Poverty Among 25-34 Year Olds |
| Swedes | 95.4 /100 | #104 | Exceptional 12.7% |
| Immigrants | South Africa | 95.3 /100 | #105 | Exceptional 12.7% |
| Tsimshian | 95.1 /100 | #106 | Exceptional 12.7% |
| Poles | 94.9 /100 | #107 | Exceptional 12.7% |
| Immigrants | Norway | 94.4 /100 | #108 | Exceptional 12.7% |
| Immigrants | Peru | 94.3 /100 | #109 | Exceptional 12.7% |
| Australians | 94.1 /100 | #110 | Exceptional 12.8% |
| Danes | 93.9 /100 | #111 | Exceptional 12.8% |
| Immigrants | Morocco | 93.9 /100 | #112 | Exceptional 12.8% |
| Immigrants | Syria | 93.8 /100 | #113 | Exceptional 12.8% |
| Immigrants | Southern Europe | 93.6 /100 | #114 | Exceptional 12.8% |
| Immigrants | Brazil | 93.3 /100 | #115 | Exceptional 12.8% |
| Chileans | 93.2 /100 | #116 | Exceptional 12.8% |
| Immigrants | Kuwait | 93.1 /100 | #117 | Exceptional 12.8% |
| Mongolians | 93.0 /100 | #118 | Exceptional 12.8% |