Immigrants from Taiwan vs Puerto Rican Child Poverty Among Boys Under 16
COMPARE
Immigrants from Taiwan
Puerto Rican
Child Poverty Among Boys Under 16
Child Poverty Among Boys Under 16 Comparison
Immigrants from Taiwan
Puerto Ricans
11.0%
CHILD POVERTY AMONG BOYS UNDER 16
100.0/ 100
METRIC RATING
2nd/ 347
METRIC RANK
32.8%
CHILD POVERTY AMONG BOYS UNDER 16
0.0/ 100
METRIC RATING
347th/ 347
METRIC RANK
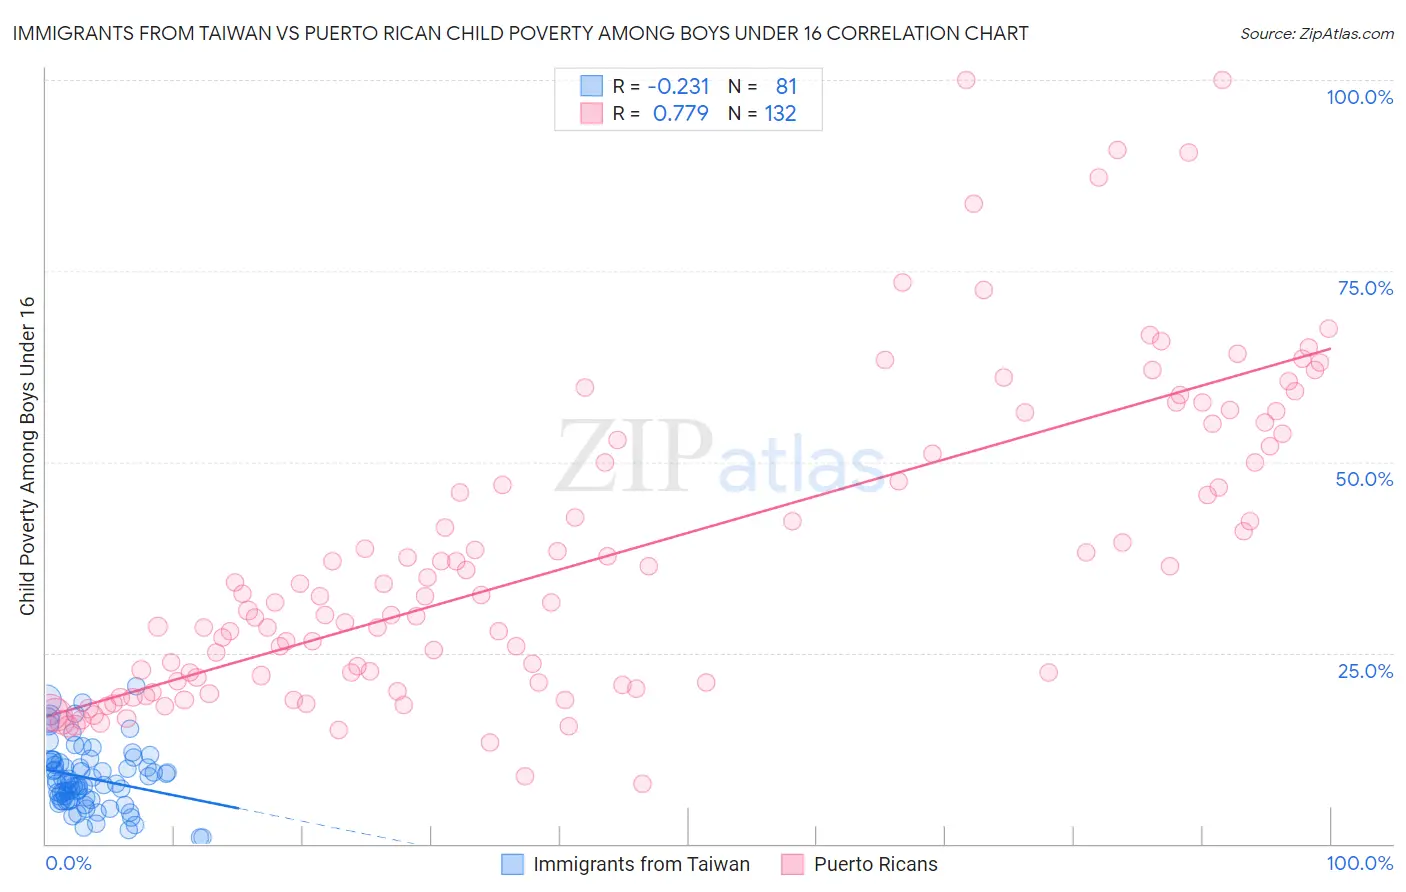
Immigrants from Taiwan vs Puerto Rican Child Poverty Among Boys Under 16 Correlation Chart
The statistical analysis conducted on geographies consisting of 293,651,008 people shows a weak negative correlation between the proportion of Immigrants from Taiwan and poverty level among boys under the age of 16 in the United States with a correlation coefficient (R) of -0.231 and weighted average of 11.0%. Similarly, the statistical analysis conducted on geographies consisting of 514,590,520 people shows a strong positive correlation between the proportion of Puerto Ricans and poverty level among boys under the age of 16 in the United States with a correlation coefficient (R) of 0.779 and weighted average of 32.8%, a difference of 197.8%.
Child Poverty Among Boys Under 16 Correlation Summary
| Measurement | Immigrants from Taiwan | Puerto Rican |
| Minimum | 0.83% | 7.9% |
| Maximum | 20.6% | 100.0% |
| Range | 19.8% | 92.1% |
| Mean | 8.6% | 37.5% |
| Median | 7.9% | 32.4% |
| Interquartile 25% (IQ1) | 5.6% | 21.2% |
| Interquartile 75% (IQ3) | 10.9% | 51.6% |
| Interquartile Range (IQR) | 5.2% | 30.4% |
| Standard Deviation (Sample) | 4.2% | 20.1% |
| Standard Deviation (Population) | 4.1% | 20.0% |
Similar Demographics by Child Poverty Among Boys Under 16
Demographics Similar to Immigrants from Taiwan by Child Poverty Among Boys Under 16
In terms of child poverty among boys under 16, the demographic groups most similar to Immigrants from Taiwan are Filipino (11.1%, a difference of 0.78%), Immigrants from India (10.9%, a difference of 1.5%), Thai (11.7%, a difference of 5.9%), Chinese (11.9%, a difference of 7.6%), and Immigrants from Hong Kong (12.3%, a difference of 11.1%).
| Demographics | Rating | Rank | Child Poverty Among Boys Under 16 |
| Immigrants | India | 100.0 /100 | #1 | Exceptional 10.9% |
| Immigrants | Taiwan | 100.0 /100 | #2 | Exceptional 11.0% |
| Filipinos | 100.0 /100 | #3 | Exceptional 11.1% |
| Thais | 100.0 /100 | #4 | Exceptional 11.7% |
| Chinese | 100.0 /100 | #5 | Exceptional 11.9% |
| Immigrants | Hong Kong | 100.0 /100 | #6 | Exceptional 12.3% |
| Iranians | 100.0 /100 | #7 | Exceptional 12.4% |
| Immigrants | Singapore | 100.0 /100 | #8 | Exceptional 12.5% |
| Immigrants | Iran | 100.0 /100 | #9 | Exceptional 12.5% |
| Bhutanese | 100.0 /100 | #10 | Exceptional 12.6% |
| Immigrants | South Central Asia | 100.0 /100 | #11 | Exceptional 12.7% |
| Burmese | 99.9 /100 | #12 | Exceptional 13.0% |
| Immigrants | Korea | 99.9 /100 | #13 | Exceptional 13.0% |
| Immigrants | Ireland | 99.9 /100 | #14 | Exceptional 13.1% |
| Immigrants | Japan | 99.9 /100 | #15 | Exceptional 13.1% |
Demographics Similar to Puerto Ricans by Child Poverty Among Boys Under 16
In terms of child poverty among boys under 16, the demographic groups most similar to Puerto Ricans are Lumbee (31.9%, a difference of 2.9%), Tohono O'odham (31.6%, a difference of 4.1%), Yuman (30.6%, a difference of 7.2%), Navajo (30.3%, a difference of 8.4%), and Pima (29.7%, a difference of 10.4%).
| Demographics | Rating | Rank | Child Poverty Among Boys Under 16 |
| Apache | 0.0 /100 | #333 | Tragic 24.5% |
| Blacks/African Americans | 0.0 /100 | #334 | Tragic 24.5% |
| Yup'ik | 0.0 /100 | #335 | Tragic 24.7% |
| Sioux | 0.0 /100 | #336 | Tragic 25.3% |
| Cheyenne | 0.0 /100 | #337 | Tragic 25.8% |
| Hopi | 0.0 /100 | #338 | Tragic 25.9% |
| Houma | 0.0 /100 | #339 | Tragic 26.2% |
| Crow | 0.0 /100 | #340 | Tragic 26.3% |
| Immigrants | Yemen | 0.0 /100 | #341 | Tragic 28.9% |
| Pima | 0.0 /100 | #342 | Tragic 29.7% |
| Navajo | 0.0 /100 | #343 | Tragic 30.3% |
| Yuman | 0.0 /100 | #344 | Tragic 30.6% |
| Tohono O'odham | 0.0 /100 | #345 | Tragic 31.6% |
| Lumbee | 0.0 /100 | #346 | Tragic 31.9% |
| Puerto Ricans | 0.0 /100 | #347 | Tragic 32.8% |