Immigrants from Syria vs Immigrants from South America Child Poverty Under the Age of 5
COMPARE
Immigrants from Syria
Immigrants from South America
Child Poverty Under the Age of 5
Child Poverty Under the Age of 5 Comparison
Immigrants from Syria
Immigrants from South America
16.8%
CHILD POVERTY UNDER THE AGE OF 5
72.3/ 100
METRIC RATING
159th/ 347
METRIC RANK
17.1%
CHILD POVERTY UNDER THE AGE OF 5
60.0/ 100
METRIC RATING
169th/ 347
METRIC RANK
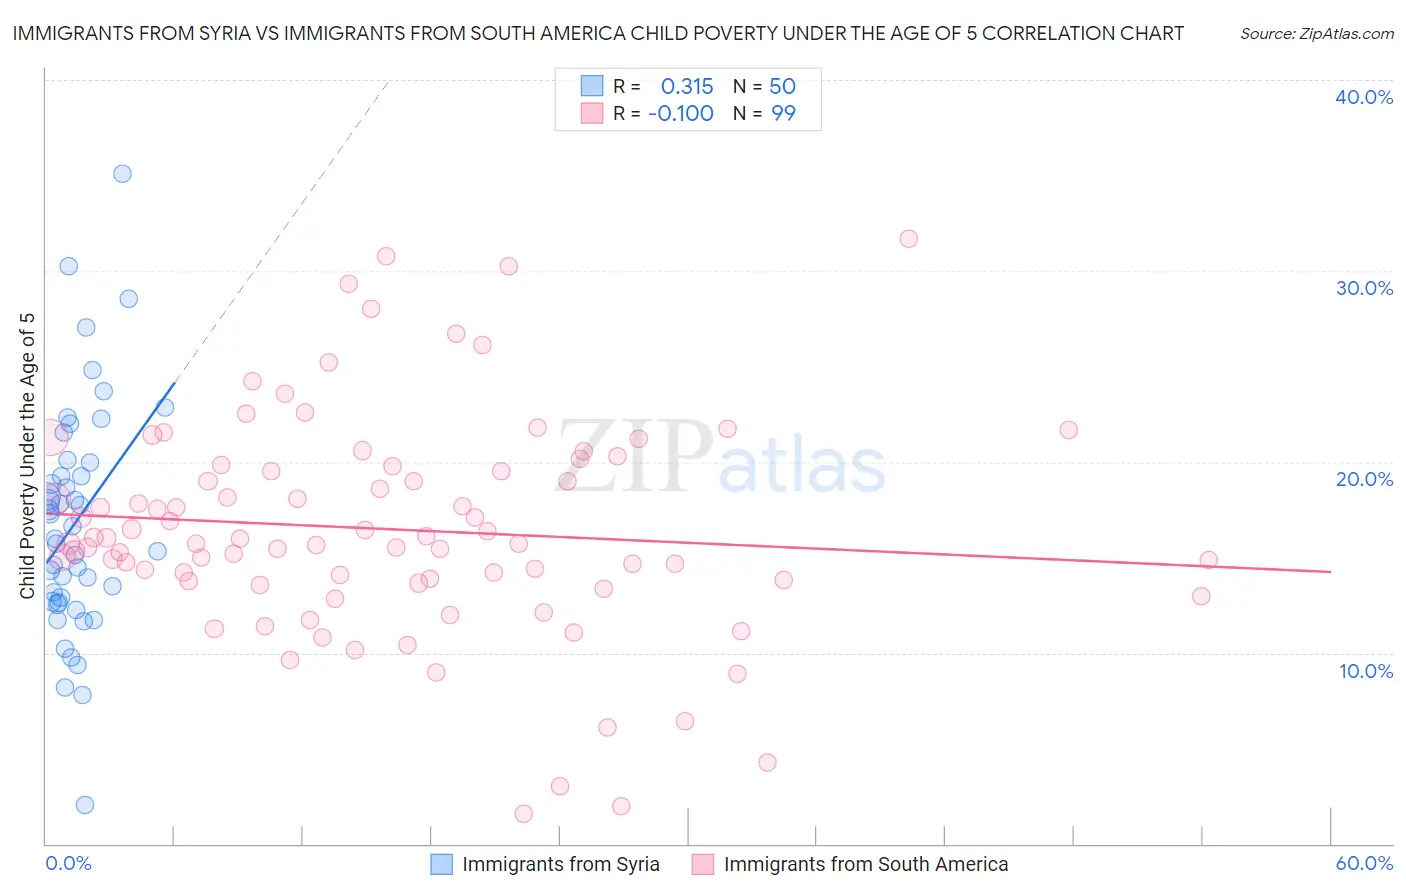
Immigrants from Syria vs Immigrants from South America Child Poverty Under the Age of 5 Correlation Chart
The statistical analysis conducted on geographies consisting of 170,490,515 people shows a mild positive correlation between the proportion of Immigrants from Syria and poverty level among children under the age of 5 in the United States with a correlation coefficient (R) of 0.315 and weighted average of 16.8%. Similarly, the statistical analysis conducted on geographies consisting of 460,876,125 people shows a slight negative correlation between the proportion of Immigrants from South America and poverty level among children under the age of 5 in the United States with a correlation coefficient (R) of -0.100 and weighted average of 17.1%, a difference of 1.5%.
Child Poverty Under the Age of 5 Correlation Summary
| Measurement | Immigrants from Syria | Immigrants from South America |
| Minimum | 2.0% | 1.6% |
| Maximum | 35.1% | 31.7% |
| Range | 33.0% | 30.1% |
| Mean | 16.9% | 16.5% |
| Median | 16.3% | 15.7% |
| Interquartile 25% (IQ1) | 12.7% | 13.7% |
| Interquartile 75% (IQ3) | 20.0% | 19.8% |
| Interquartile Range (IQR) | 7.3% | 6.0% |
| Standard Deviation (Sample) | 6.1% | 5.8% |
| Standard Deviation (Population) | 6.0% | 5.7% |
Demographics Similar to Immigrants from Syria and Immigrants from South America by Child Poverty Under the Age of 5
In terms of child poverty under the age of 5, the demographic groups most similar to Immigrants from Syria are Irish (16.8%, a difference of 0.030%), Czechoslovakian (16.8%, a difference of 0.040%), Venezuelan (16.8%, a difference of 0.20%), English (16.8%, a difference of 0.25%), and Afghan (16.8%, a difference of 0.29%). Similarly, the demographic groups most similar to Immigrants from South America are Uruguayan (17.0%, a difference of 0.050%), Immigrants from Western Asia (17.1%, a difference of 0.090%), Immigrants from Morocco (17.1%, a difference of 0.12%), Immigrants from Uzbekistan (17.0%, a difference of 0.21%), and Slavic (17.0%, a difference of 0.44%).
| Demographics | Rating | Rank | Child Poverty Under the Age of 5 |
| Immigrants | Venezuela | 76.0 /100 | #154 | Good 16.7% |
| South Americans | 75.1 /100 | #155 | Good 16.7% |
| Afghans | 74.4 /100 | #156 | Good 16.8% |
| Venezuelans | 73.7 /100 | #157 | Good 16.8% |
| Czechoslovakians | 72.5 /100 | #158 | Good 16.8% |
| Immigrants | Syria | 72.3 /100 | #159 | Good 16.8% |
| Irish | 72.0 /100 | #160 | Good 16.8% |
| English | 70.4 /100 | #161 | Good 16.8% |
| Costa Ricans | 69.8 /100 | #162 | Good 16.9% |
| Scottish | 68.6 /100 | #163 | Good 16.9% |
| Immigrants | Oceania | 67.6 /100 | #164 | Good 16.9% |
| Immigrants | Colombia | 66.9 /100 | #165 | Good 16.9% |
| Slavs | 64.0 /100 | #166 | Good 17.0% |
| Immigrants | Uzbekistan | 62.0 /100 | #167 | Good 17.0% |
| Uruguayans | 60.5 /100 | #168 | Good 17.0% |
| Immigrants | South America | 60.0 /100 | #169 | Good 17.1% |
| Immigrants | Western Asia | 59.2 /100 | #170 | Average 17.1% |
| Immigrants | Morocco | 58.9 /100 | #171 | Average 17.1% |
| Yugoslavians | 54.1 /100 | #172 | Average 17.2% |
| Welsh | 54.0 /100 | #173 | Average 17.2% |
| Immigrants | Saudi Arabia | 50.0 /100 | #174 | Average 17.2% |