Bolivian vs Immigrants from Nepal Female Poverty Among 18-24 Year Olds
COMPARE
Bolivian
Immigrants from Nepal
Female Poverty Among 18-24 Year Olds
Female Poverty Among 18-24 Year Olds Comparison
Bolivians
Immigrants from Nepal
17.4%
FEMALE POVERTY AMONG 18-24 YEAR OLDS
100.0/ 100
METRIC RATING
21st/ 347
METRIC RANK
20.7%
FEMALE POVERTY AMONG 18-24 YEAR OLDS
9.6/ 100
METRIC RATING
218th/ 347
METRIC RANK
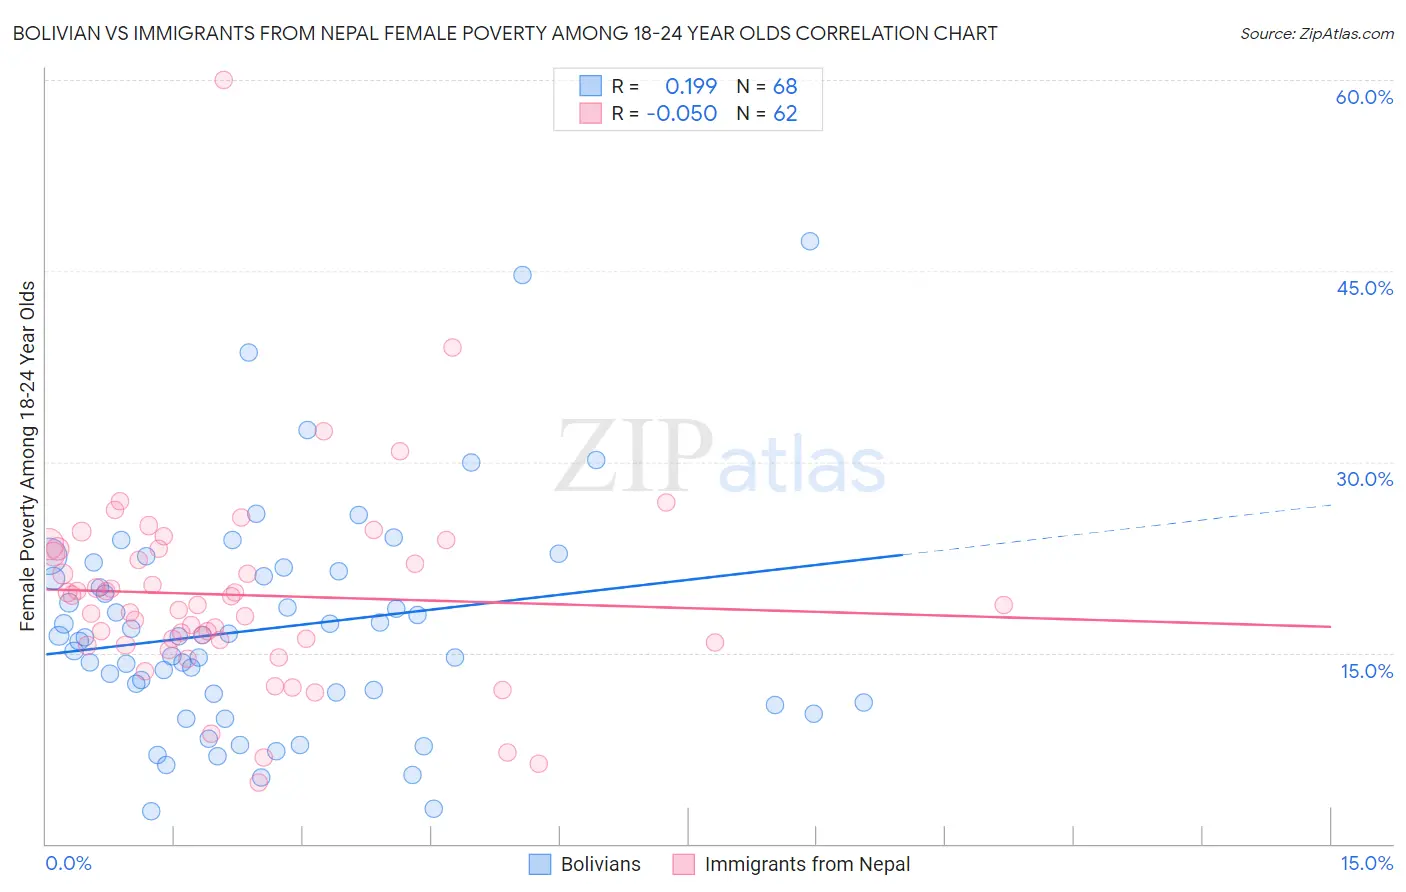
Bolivian vs Immigrants from Nepal Female Poverty Among 18-24 Year Olds Correlation Chart
The statistical analysis conducted on geographies consisting of 182,623,221 people shows a poor positive correlation between the proportion of Bolivians and poverty level among females between the ages 18 and 24 in the United States with a correlation coefficient (R) of 0.199 and weighted average of 17.4%. Similarly, the statistical analysis conducted on geographies consisting of 184,918,180 people shows a slight negative correlation between the proportion of Immigrants from Nepal and poverty level among females between the ages 18 and 24 in the United States with a correlation coefficient (R) of -0.050 and weighted average of 20.7%, a difference of 18.4%.
Female Poverty Among 18-24 Year Olds Correlation Summary
| Measurement | Bolivian | Immigrants from Nepal |
| Minimum | 2.6% | 4.8% |
| Maximum | 47.4% | 60.0% |
| Range | 44.8% | 55.2% |
| Mean | 16.9% | 19.5% |
| Median | 16.2% | 18.8% |
| Interquartile 25% (IQ1) | 11.4% | 15.8% |
| Interquartile 75% (IQ3) | 21.2% | 23.1% |
| Interquartile Range (IQR) | 9.8% | 7.4% |
| Standard Deviation (Sample) | 8.7% | 8.1% |
| Standard Deviation (Population) | 8.7% | 8.0% |
Similar Demographics by Female Poverty Among 18-24 Year Olds
Demographics Similar to Bolivians by Female Poverty Among 18-24 Year Olds
In terms of female poverty among 18-24 year olds, the demographic groups most similar to Bolivians are Immigrants from Venezuela (17.4%, a difference of 0.0%), Immigrants from Hong Kong (17.5%, a difference of 0.10%), Immigrants from Lithuania (17.4%, a difference of 0.13%), Immigrants from Colombia (17.3%, a difference of 0.54%), and Immigrants from North Macedonia (17.6%, a difference of 0.67%).
| Demographics | Rating | Rank | Female Poverty Among 18-24 Year Olds |
| Tongans | 100.0 /100 | #14 | Exceptional 17.1% |
| Cubans | 100.0 /100 | #15 | Exceptional 17.2% |
| Peruvians | 100.0 /100 | #16 | Exceptional 17.2% |
| Immigrants | Taiwan | 100.0 /100 | #17 | Exceptional 17.3% |
| Immigrants | Colombia | 100.0 /100 | #18 | Exceptional 17.3% |
| Immigrants | Lithuania | 100.0 /100 | #19 | Exceptional 17.4% |
| Immigrants | Venezuela | 100.0 /100 | #20 | Exceptional 17.4% |
| Bolivians | 100.0 /100 | #21 | Exceptional 17.4% |
| Immigrants | Hong Kong | 100.0 /100 | #22 | Exceptional 17.5% |
| Immigrants | North Macedonia | 100.0 /100 | #23 | Exceptional 17.6% |
| Maltese | 100.0 /100 | #24 | Exceptional 17.6% |
| Immigrants | South Central Asia | 100.0 /100 | #25 | Exceptional 17.6% |
| Immigrants | Fiji | 100.0 /100 | #26 | Exceptional 17.7% |
| Colombians | 100.0 /100 | #27 | Exceptional 17.7% |
| Venezuelans | 100.0 /100 | #28 | Exceptional 17.7% |
Demographics Similar to Immigrants from Nepal by Female Poverty Among 18-24 Year Olds
In terms of female poverty among 18-24 year olds, the demographic groups most similar to Immigrants from Nepal are Immigrants from Laos (20.6%, a difference of 0.010%), Immigrants from Micronesia (20.7%, a difference of 0.010%), British (20.7%, a difference of 0.030%), Immigrants from Western Africa (20.6%, a difference of 0.080%), and Spanish (20.6%, a difference of 0.10%).
| Demographics | Rating | Rank | Female Poverty Among 18-24 Year Olds |
| Immigrants | Western Europe | 13.5 /100 | #211 | Poor 20.6% |
| Liberians | 11.6 /100 | #212 | Poor 20.6% |
| Northern Europeans | 11.6 /100 | #213 | Poor 20.6% |
| Immigrants | South Africa | 10.7 /100 | #214 | Poor 20.6% |
| Spanish | 10.4 /100 | #215 | Poor 20.6% |
| Immigrants | Western Africa | 10.2 /100 | #216 | Poor 20.6% |
| Immigrants | Laos | 9.7 /100 | #217 | Tragic 20.6% |
| Immigrants | Nepal | 9.6 /100 | #218 | Tragic 20.7% |
| Immigrants | Micronesia | 9.6 /100 | #219 | Tragic 20.7% |
| British | 9.4 /100 | #220 | Tragic 20.7% |
| Barbadians | 9.0 /100 | #221 | Tragic 20.7% |
| Guatemalans | 8.1 /100 | #222 | Tragic 20.7% |
| French | 7.9 /100 | #223 | Tragic 20.7% |
| Immigrants | Liberia | 7.6 /100 | #224 | Tragic 20.7% |
| Norwegians | 7.3 /100 | #225 | Tragic 20.7% |