Immigrants from Switzerland vs Cuban Female Poverty Among 18-24 Year Olds
COMPARE
Immigrants from Switzerland
Cuban
Female Poverty Among 18-24 Year Olds
Female Poverty Among 18-24 Year Olds Comparison
Immigrants from Switzerland
Cubans
21.8%
FEMALE POVERTY AMONG 18-24 YEAR OLDS
0.1/ 100
METRIC RATING
277th/ 347
METRIC RANK
17.2%
FEMALE POVERTY AMONG 18-24 YEAR OLDS
100.0/ 100
METRIC RATING
15th/ 347
METRIC RANK
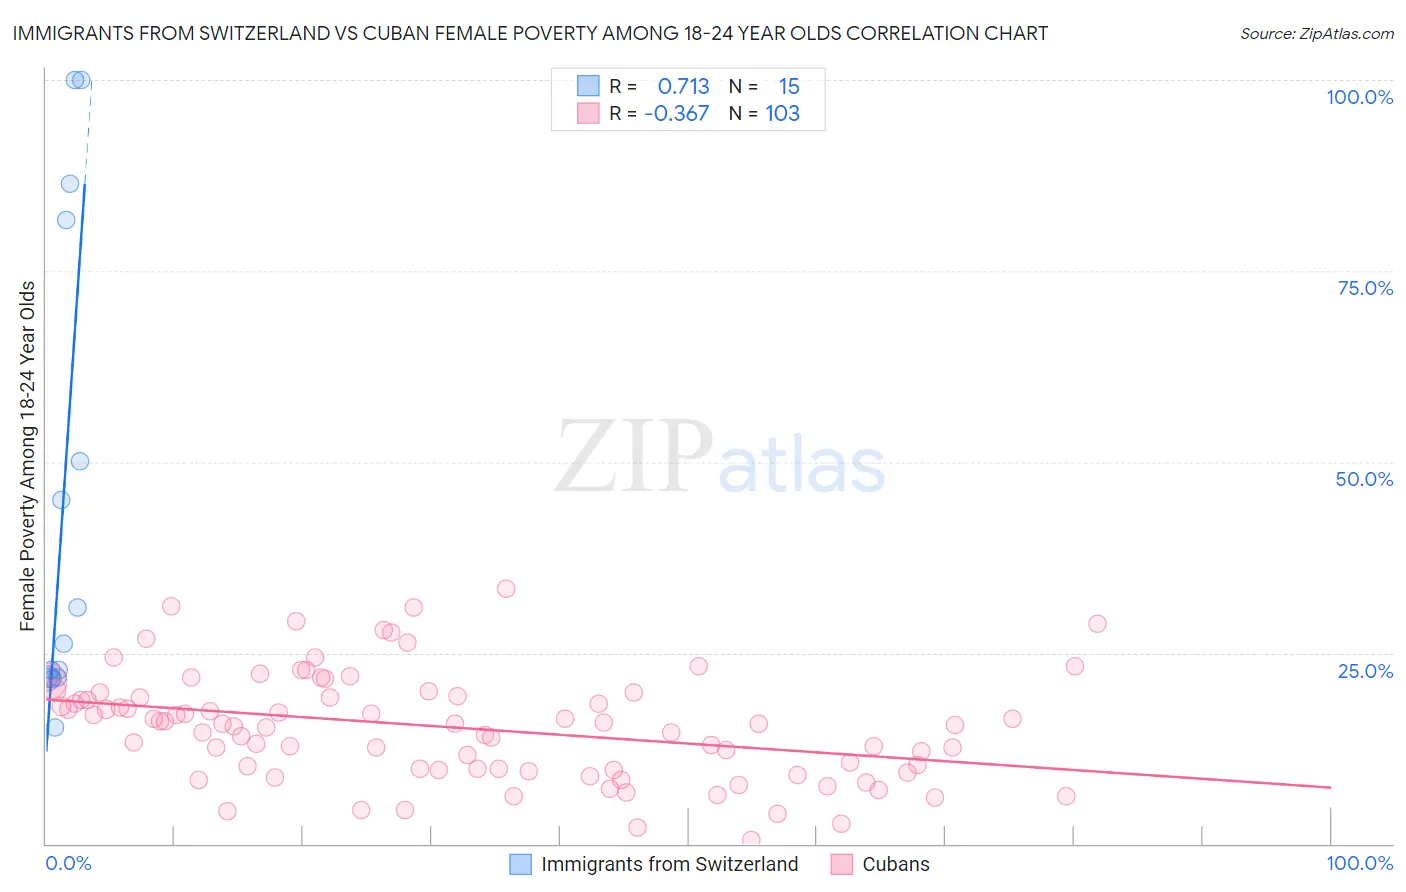
Immigrants from Switzerland vs Cuban Female Poverty Among 18-24 Year Olds Correlation Chart
The statistical analysis conducted on geographies consisting of 145,929,420 people shows a strong positive correlation between the proportion of Immigrants from Switzerland and poverty level among females between the ages 18 and 24 in the United States with a correlation coefficient (R) of 0.713 and weighted average of 21.8%. Similarly, the statistical analysis conducted on geographies consisting of 436,191,738 people shows a mild negative correlation between the proportion of Cubans and poverty level among females between the ages 18 and 24 in the United States with a correlation coefficient (R) of -0.367 and weighted average of 17.2%, a difference of 27.0%.
Female Poverty Among 18-24 Year Olds Correlation Summary
| Measurement | Immigrants from Switzerland | Cuban |
| Minimum | 15.3% | 0.55% |
| Maximum | 100.0% | 33.5% |
| Range | 84.7% | 32.9% |
| Mean | 44.5% | 15.2% |
| Median | 26.2% | 15.7% |
| Interquartile 25% (IQ1) | 21.7% | 9.6% |
| Interquartile 75% (IQ3) | 81.7% | 19.4% |
| Interquartile Range (IQR) | 59.9% | 9.7% |
| Standard Deviation (Sample) | 31.3% | 7.0% |
| Standard Deviation (Population) | 30.3% | 7.0% |
Similar Demographics by Female Poverty Among 18-24 Year Olds
Demographics Similar to Immigrants from Switzerland by Female Poverty Among 18-24 Year Olds
In terms of female poverty among 18-24 year olds, the demographic groups most similar to Immigrants from Switzerland are Bahamian (21.8%, a difference of 0.13%), Immigrants from Bangladesh (21.8%, a difference of 0.15%), Immigrants from Honduras (21.8%, a difference of 0.19%), Yaqui (21.9%, a difference of 0.26%), and Spanish American (21.9%, a difference of 0.43%).
| Demographics | Rating | Rank | Female Poverty Among 18-24 Year Olds |
| Mongolians | 0.2 /100 | #270 | Tragic 21.6% |
| Scotch-Irish | 0.2 /100 | #271 | Tragic 21.6% |
| Basques | 0.2 /100 | #272 | Tragic 21.7% |
| New Zealanders | 0.2 /100 | #273 | Tragic 21.7% |
| Immigrants | Honduras | 0.1 /100 | #274 | Tragic 21.8% |
| Immigrants | Bangladesh | 0.1 /100 | #275 | Tragic 21.8% |
| Bahamians | 0.1 /100 | #276 | Tragic 21.8% |
| Immigrants | Switzerland | 0.1 /100 | #277 | Tragic 21.8% |
| Yaqui | 0.1 /100 | #278 | Tragic 21.9% |
| Spanish Americans | 0.1 /100 | #279 | Tragic 21.9% |
| Immigrants | Dominica | 0.1 /100 | #280 | Tragic 21.9% |
| Immigrants | Dominican Republic | 0.1 /100 | #281 | Tragic 21.9% |
| Bermudans | 0.1 /100 | #282 | Tragic 21.9% |
| Sub-Saharan Africans | 0.0 /100 | #283 | Tragic 22.0% |
| Tlingit-Haida | 0.0 /100 | #284 | Tragic 22.0% |
Demographics Similar to Cubans by Female Poverty Among 18-24 Year Olds
In terms of female poverty among 18-24 year olds, the demographic groups most similar to Cubans are Peruvian (17.2%, a difference of 0.23%), Tongan (17.1%, a difference of 0.28%), Immigrants from Poland (17.1%, a difference of 0.45%), Immigrants from Taiwan (17.3%, a difference of 0.48%), and Immigrants from Colombia (17.3%, a difference of 0.94%).
| Demographics | Rating | Rank | Female Poverty Among 18-24 Year Olds |
| Immigrants | Bolivia | 100.0 /100 | #8 | Exceptional 16.7% |
| Immigrants | Peru | 100.0 /100 | #9 | Exceptional 16.9% |
| Koreans | 100.0 /100 | #10 | Exceptional 16.9% |
| Thais | 100.0 /100 | #11 | Exceptional 17.0% |
| Immigrants | Pakistan | 100.0 /100 | #12 | Exceptional 17.0% |
| Immigrants | Poland | 100.0 /100 | #13 | Exceptional 17.1% |
| Tongans | 100.0 /100 | #14 | Exceptional 17.1% |
| Cubans | 100.0 /100 | #15 | Exceptional 17.2% |
| Peruvians | 100.0 /100 | #16 | Exceptional 17.2% |
| Immigrants | Taiwan | 100.0 /100 | #17 | Exceptional 17.3% |
| Immigrants | Colombia | 100.0 /100 | #18 | Exceptional 17.3% |
| Immigrants | Lithuania | 100.0 /100 | #19 | Exceptional 17.4% |
| Immigrants | Venezuela | 100.0 /100 | #20 | Exceptional 17.4% |
| Bolivians | 100.0 /100 | #21 | Exceptional 17.4% |
| Immigrants | Hong Kong | 100.0 /100 | #22 | Exceptional 17.5% |