Immigrants from Sri Lanka vs Yaqui Female Poverty Among 18-24 Year Olds
COMPARE
Immigrants from Sri Lanka
Yaqui
Female Poverty Among 18-24 Year Olds
Female Poverty Among 18-24 Year Olds Comparison
Immigrants from Sri Lanka
Yaqui
19.2%
FEMALE POVERTY AMONG 18-24 YEAR OLDS
97.5/ 100
METRIC RATING
107th/ 347
METRIC RANK
21.9%
FEMALE POVERTY AMONG 18-24 YEAR OLDS
0.1/ 100
METRIC RATING
278th/ 347
METRIC RANK
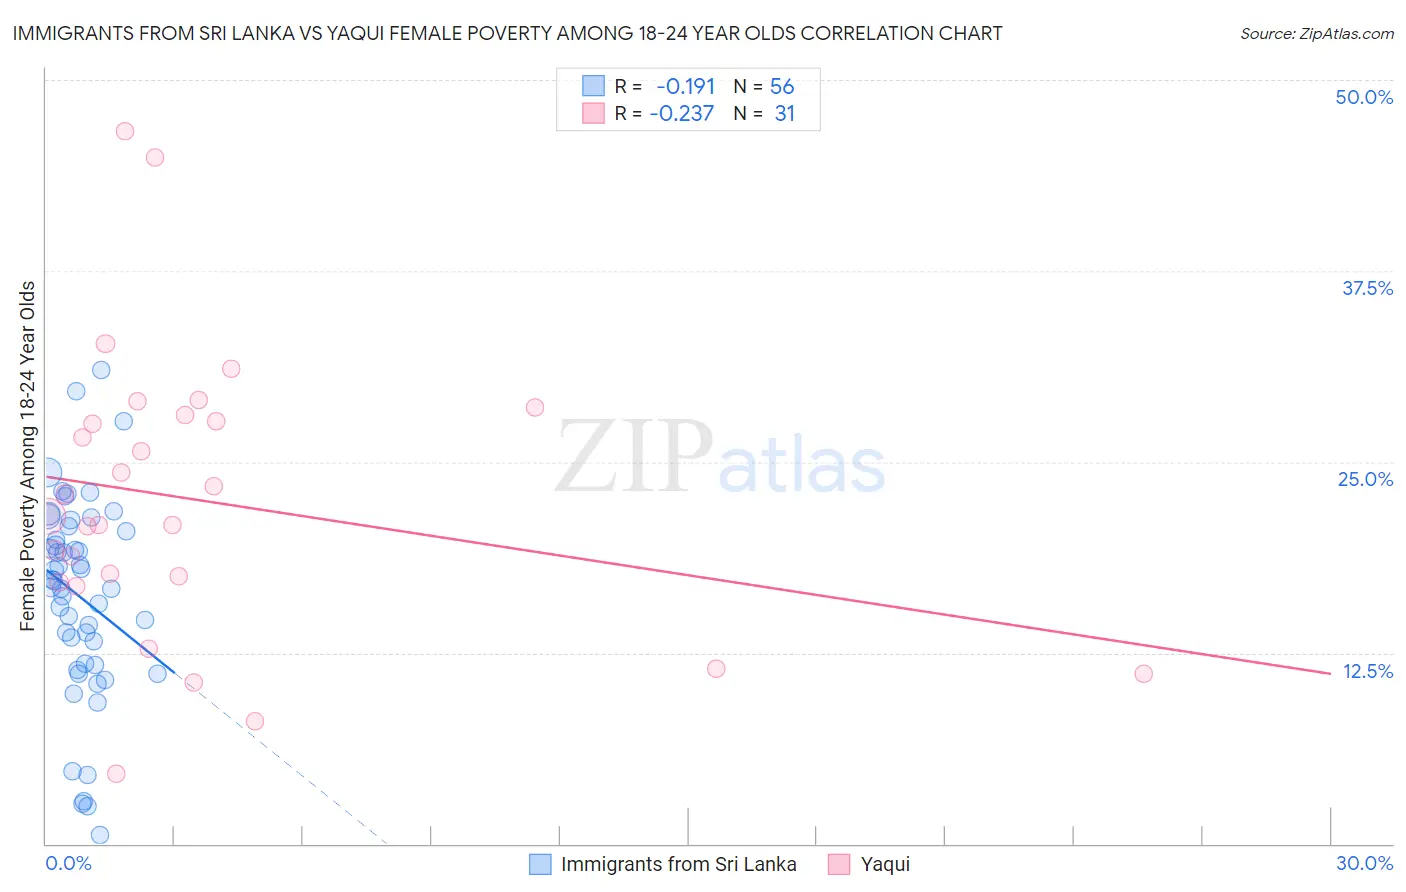
Immigrants from Sri Lanka vs Yaqui Female Poverty Among 18-24 Year Olds Correlation Chart
The statistical analysis conducted on geographies consisting of 148,449,032 people shows a poor negative correlation between the proportion of Immigrants from Sri Lanka and poverty level among females between the ages 18 and 24 in the United States with a correlation coefficient (R) of -0.191 and weighted average of 19.2%. Similarly, the statistical analysis conducted on geographies consisting of 107,118,789 people shows a weak negative correlation between the proportion of Yaqui and poverty level among females between the ages 18 and 24 in the United States with a correlation coefficient (R) of -0.237 and weighted average of 21.9%, a difference of 14.0%.
Female Poverty Among 18-24 Year Olds Correlation Summary
| Measurement | Immigrants from Sri Lanka | Yaqui |
| Minimum | 0.58% | 4.6% |
| Maximum | 31.0% | 46.7% |
| Range | 30.5% | 42.1% |
| Mean | 16.2% | 22.5% |
| Median | 17.0% | 21.4% |
| Interquartile 25% (IQ1) | 11.7% | 17.1% |
| Interquartile 75% (IQ3) | 20.6% | 28.1% |
| Interquartile Range (IQR) | 8.9% | 11.0% |
| Standard Deviation (Sample) | 6.6% | 9.4% |
| Standard Deviation (Population) | 6.6% | 9.3% |
Similar Demographics by Female Poverty Among 18-24 Year Olds
Demographics Similar to Immigrants from Sri Lanka by Female Poverty Among 18-24 Year Olds
In terms of female poverty among 18-24 year olds, the demographic groups most similar to Immigrants from Sri Lanka are Immigrants from Uzbekistan (19.2%, a difference of 0.090%), Immigrants from Sierra Leone (19.2%, a difference of 0.15%), Immigrants from Syria (19.2%, a difference of 0.17%), Immigrants from Ecuador (19.2%, a difference of 0.19%), and Laotian (19.2%, a difference of 0.20%).
| Demographics | Rating | Rank | Female Poverty Among 18-24 Year Olds |
| Chileans | 98.3 /100 | #100 | Exceptional 19.1% |
| Ecuadorians | 98.1 /100 | #101 | Exceptional 19.1% |
| Immigrants | Caribbean | 98.1 /100 | #102 | Exceptional 19.1% |
| Serbians | 98.0 /100 | #103 | Exceptional 19.1% |
| Immigrants | Afghanistan | 98.0 /100 | #104 | Exceptional 19.1% |
| Immigrants | Ecuador | 97.8 /100 | #105 | Exceptional 19.2% |
| Immigrants | Sierra Leone | 97.8 /100 | #106 | Exceptional 19.2% |
| Immigrants | Sri Lanka | 97.5 /100 | #107 | Exceptional 19.2% |
| Immigrants | Uzbekistan | 97.3 /100 | #108 | Exceptional 19.2% |
| Immigrants | Syria | 97.2 /100 | #109 | Exceptional 19.2% |
| Laotians | 97.1 /100 | #110 | Exceptional 19.2% |
| Immigrants | Serbia | 97.1 /100 | #111 | Exceptional 19.2% |
| Immigrants | El Salvador | 96.5 /100 | #112 | Exceptional 19.3% |
| Immigrants | Cameroon | 96.3 /100 | #113 | Exceptional 19.3% |
| Slovenes | 96.2 /100 | #114 | Exceptional 19.3% |
Demographics Similar to Yaqui by Female Poverty Among 18-24 Year Olds
In terms of female poverty among 18-24 year olds, the demographic groups most similar to Yaqui are Spanish American (21.9%, a difference of 0.17%), Immigrants from Dominica (21.9%, a difference of 0.18%), Immigrants from Dominican Republic (21.9%, a difference of 0.22%), Immigrants from Switzerland (21.8%, a difference of 0.26%), and Bermudan (21.9%, a difference of 0.31%).
| Demographics | Rating | Rank | Female Poverty Among 18-24 Year Olds |
| Scotch-Irish | 0.2 /100 | #271 | Tragic 21.6% |
| Basques | 0.2 /100 | #272 | Tragic 21.7% |
| New Zealanders | 0.2 /100 | #273 | Tragic 21.7% |
| Immigrants | Honduras | 0.1 /100 | #274 | Tragic 21.8% |
| Immigrants | Bangladesh | 0.1 /100 | #275 | Tragic 21.8% |
| Bahamians | 0.1 /100 | #276 | Tragic 21.8% |
| Immigrants | Switzerland | 0.1 /100 | #277 | Tragic 21.8% |
| Yaqui | 0.1 /100 | #278 | Tragic 21.9% |
| Spanish Americans | 0.1 /100 | #279 | Tragic 21.9% |
| Immigrants | Dominica | 0.1 /100 | #280 | Tragic 21.9% |
| Immigrants | Dominican Republic | 0.1 /100 | #281 | Tragic 21.9% |
| Bermudans | 0.1 /100 | #282 | Tragic 21.9% |
| Sub-Saharan Africans | 0.0 /100 | #283 | Tragic 22.0% |
| Tlingit-Haida | 0.0 /100 | #284 | Tragic 22.0% |
| Ottawa | 0.0 /100 | #285 | Tragic 22.0% |