Immigrants from Somalia vs Immigrants from Senegal Seniors Poverty Over the Age of 65
COMPARE
Immigrants from Somalia
Immigrants from Senegal
Seniors Poverty Over the Age of 65
Seniors Poverty Over the Age of 65 Comparison
Immigrants from Somalia
Immigrants from Senegal
12.6%
SENIORS POVERTY OVER THE AGE OF 65
0.1/ 100
METRIC RATING
268th/ 347
METRIC RANK
13.6%
SENIORS POVERTY OVER THE AGE OF 65
0.0/ 100
METRIC RATING
286th/ 347
METRIC RANK
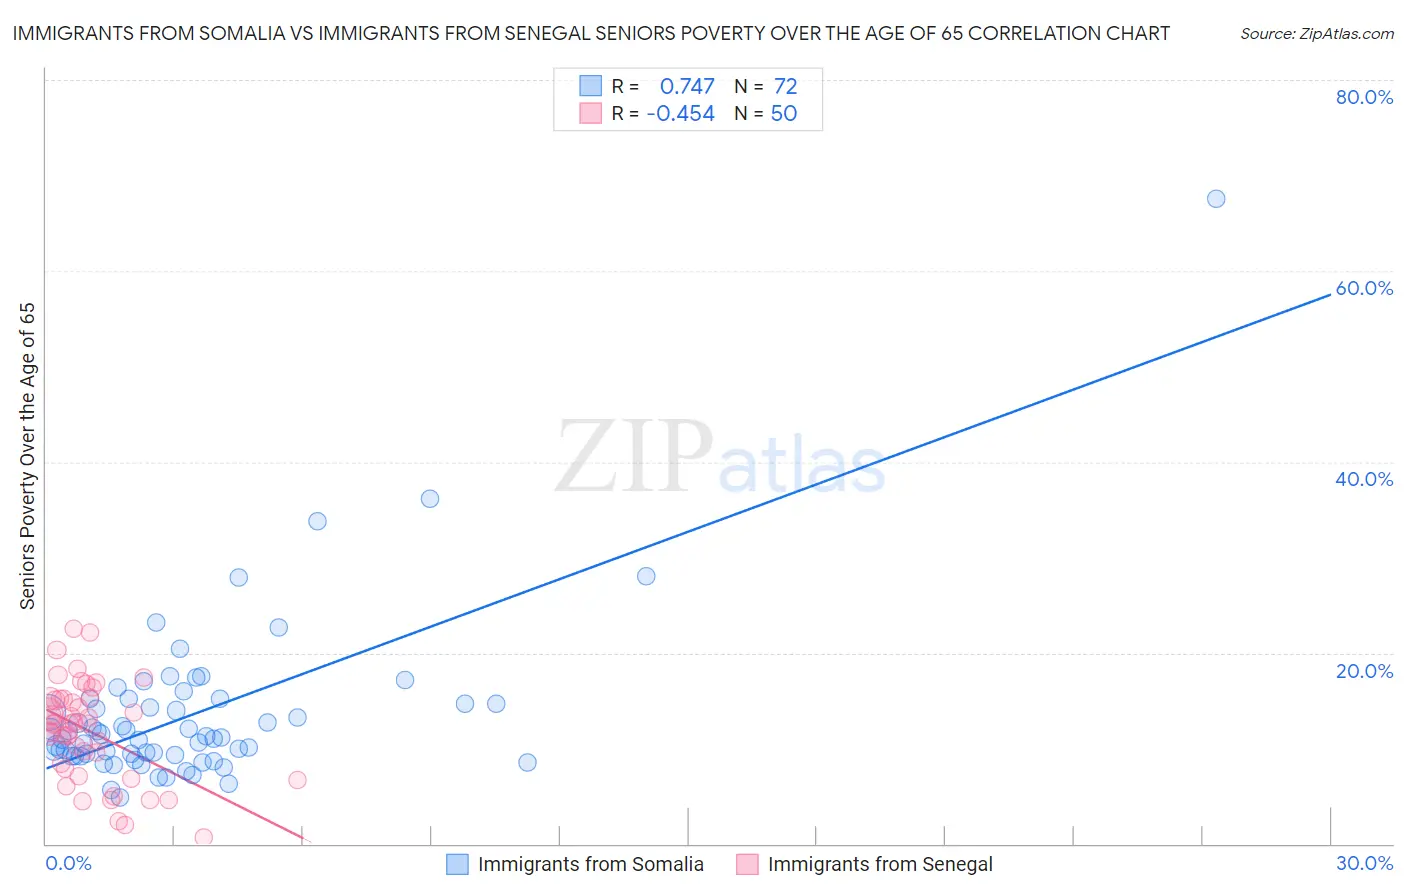
Immigrants from Somalia vs Immigrants from Senegal Seniors Poverty Over the Age of 65 Correlation Chart
The statistical analysis conducted on geographies consisting of 92,073,309 people shows a strong positive correlation between the proportion of Immigrants from Somalia and poverty level among seniors over the age of 65 in the United States with a correlation coefficient (R) of 0.747 and weighted average of 12.6%. Similarly, the statistical analysis conducted on geographies consisting of 90,070,105 people shows a moderate negative correlation between the proportion of Immigrants from Senegal and poverty level among seniors over the age of 65 in the United States with a correlation coefficient (R) of -0.454 and weighted average of 13.6%, a difference of 7.5%.
Seniors Poverty Over the Age of 65 Correlation Summary
| Measurement | Immigrants from Somalia | Immigrants from Senegal |
| Minimum | 4.8% | 0.71% |
| Maximum | 67.5% | 22.5% |
| Range | 62.7% | 21.8% |
| Mean | 13.6% | 11.8% |
| Median | 11.1% | 12.6% |
| Interquartile 25% (IQ1) | 9.3% | 7.9% |
| Interquartile 75% (IQ3) | 14.9% | 15.2% |
| Interquartile Range (IQR) | 5.7% | 7.3% |
| Standard Deviation (Sample) | 8.8% | 5.2% |
| Standard Deviation (Population) | 8.7% | 5.1% |
Demographics Similar to Immigrants from Somalia and Immigrants from Senegal by Seniors Poverty Over the Age of 65
In terms of seniors poverty over the age of 65, the demographic groups most similar to Immigrants from Somalia are Blackfeet (12.6%, a difference of 0.10%), Immigrants from Venezuela (12.7%, a difference of 0.60%), Immigrants from South America (12.7%, a difference of 0.84%), Immigrants from Ghana (12.8%, a difference of 1.1%), and Immigrants from Uruguay (12.8%, a difference of 1.1%). Similarly, the demographic groups most similar to Immigrants from Senegal are Immigrants from Mexico (13.6%, a difference of 0.12%), Guatemalan (13.5%, a difference of 0.27%), Colville (13.5%, a difference of 0.50%), Central American (13.4%, a difference of 1.4%), and Senegalese (13.3%, a difference of 2.2%).
| Demographics | Rating | Rank | Seniors Poverty Over the Age of 65 |
| Blackfeet | 0.1 /100 | #267 | Tragic 12.6% |
| Immigrants | Somalia | 0.1 /100 | #268 | Tragic 12.6% |
| Immigrants | Venezuela | 0.1 /100 | #269 | Tragic 12.7% |
| Immigrants | South America | 0.1 /100 | #270 | Tragic 12.7% |
| Immigrants | Ghana | 0.1 /100 | #271 | Tragic 12.8% |
| Immigrants | Uruguay | 0.1 /100 | #272 | Tragic 12.8% |
| Kiowa | 0.0 /100 | #273 | Tragic 12.8% |
| Salvadorans | 0.0 /100 | #274 | Tragic 12.8% |
| Immigrants | Colombia | 0.0 /100 | #275 | Tragic 12.9% |
| Immigrants | Azores | 0.0 /100 | #276 | Tragic 12.9% |
| Paiute | 0.0 /100 | #277 | Tragic 12.9% |
| Immigrants | Bahamas | 0.0 /100 | #278 | Tragic 13.0% |
| Mexicans | 0.0 /100 | #279 | Tragic 13.1% |
| Yuman | 0.0 /100 | #280 | Tragic 13.1% |
| Immigrants | El Salvador | 0.0 /100 | #281 | Tragic 13.1% |
| Senegalese | 0.0 /100 | #282 | Tragic 13.3% |
| Central Americans | 0.0 /100 | #283 | Tragic 13.4% |
| Colville | 0.0 /100 | #284 | Tragic 13.5% |
| Guatemalans | 0.0 /100 | #285 | Tragic 13.5% |
| Immigrants | Senegal | 0.0 /100 | #286 | Tragic 13.6% |
| Immigrants | Mexico | 0.0 /100 | #287 | Tragic 13.6% |