Immigrants from Somalia vs Cuban Seniors Poverty Over the Age of 65
COMPARE
Immigrants from Somalia
Cuban
Seniors Poverty Over the Age of 65
Seniors Poverty Over the Age of 65 Comparison
Immigrants from Somalia
Cubans
12.6%
SENIORS POVERTY OVER THE AGE OF 65
0.1/ 100
METRIC RATING
268th/ 347
METRIC RANK
16.1%
SENIORS POVERTY OVER THE AGE OF 65
0.0/ 100
METRIC RATING
335th/ 347
METRIC RANK
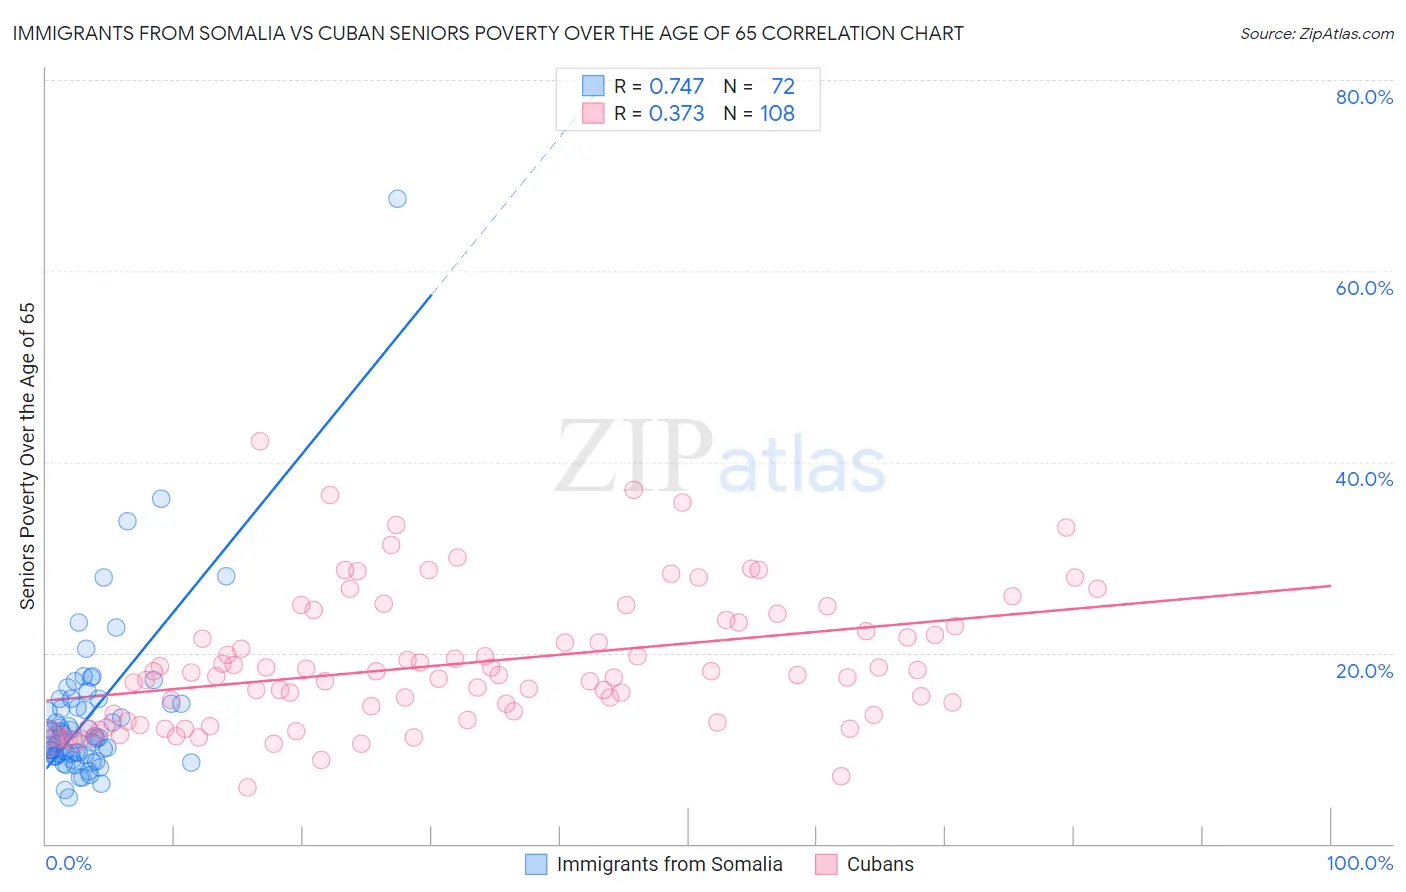
Immigrants from Somalia vs Cuban Seniors Poverty Over the Age of 65 Correlation Chart
The statistical analysis conducted on geographies consisting of 92,073,309 people shows a strong positive correlation between the proportion of Immigrants from Somalia and poverty level among seniors over the age of 65 in the United States with a correlation coefficient (R) of 0.747 and weighted average of 12.6%. Similarly, the statistical analysis conducted on geographies consisting of 447,431,553 people shows a mild positive correlation between the proportion of Cubans and poverty level among seniors over the age of 65 in the United States with a correlation coefficient (R) of 0.373 and weighted average of 16.1%, a difference of 27.6%.
Seniors Poverty Over the Age of 65 Correlation Summary
| Measurement | Immigrants from Somalia | Cuban |
| Minimum | 4.8% | 5.9% |
| Maximum | 67.5% | 42.2% |
| Range | 62.7% | 36.3% |
| Mean | 13.6% | 18.8% |
| Median | 11.1% | 17.7% |
| Interquartile 25% (IQ1) | 9.3% | 12.9% |
| Interquartile 75% (IQ3) | 14.9% | 23.0% |
| Interquartile Range (IQR) | 5.7% | 10.1% |
| Standard Deviation (Sample) | 8.8% | 7.1% |
| Standard Deviation (Population) | 8.7% | 7.1% |
Similar Demographics by Seniors Poverty Over the Age of 65
Demographics Similar to Immigrants from Somalia by Seniors Poverty Over the Age of 65
In terms of seniors poverty over the age of 65, the demographic groups most similar to Immigrants from Somalia are Blackfeet (12.6%, a difference of 0.10%), African (12.6%, a difference of 0.24%), Immigrants from Western Africa (12.6%, a difference of 0.41%), Inupiat (12.6%, a difference of 0.50%), and Soviet Union (12.6%, a difference of 0.57%).
| Demographics | Rating | Rank | Seniors Poverty Over the Age of 65 |
| Colombians | 0.2 /100 | #261 | Tragic 12.5% |
| Venezuelans | 0.1 /100 | #262 | Tragic 12.5% |
| Soviet Union | 0.1 /100 | #263 | Tragic 12.6% |
| Inupiat | 0.1 /100 | #264 | Tragic 12.6% |
| Immigrants | Western Africa | 0.1 /100 | #265 | Tragic 12.6% |
| Africans | 0.1 /100 | #266 | Tragic 12.6% |
| Blackfeet | 0.1 /100 | #267 | Tragic 12.6% |
| Immigrants | Somalia | 0.1 /100 | #268 | Tragic 12.6% |
| Immigrants | Venezuela | 0.1 /100 | #269 | Tragic 12.7% |
| Immigrants | South America | 0.1 /100 | #270 | Tragic 12.7% |
| Immigrants | Ghana | 0.1 /100 | #271 | Tragic 12.8% |
| Immigrants | Uruguay | 0.1 /100 | #272 | Tragic 12.8% |
| Kiowa | 0.0 /100 | #273 | Tragic 12.8% |
| Salvadorans | 0.0 /100 | #274 | Tragic 12.8% |
| Immigrants | Colombia | 0.0 /100 | #275 | Tragic 12.9% |
Demographics Similar to Cubans by Seniors Poverty Over the Age of 65
In terms of seniors poverty over the age of 65, the demographic groups most similar to Cubans are Immigrants from Cabo Verde (16.2%, a difference of 0.57%), Immigrants from Nicaragua (15.9%, a difference of 1.3%), Immigrants from Yemen (15.9%, a difference of 1.4%), Immigrants from Grenada (15.8%, a difference of 1.9%), and Immigrants from Caribbean (16.5%, a difference of 2.4%).
| Demographics | Rating | Rank | Seniors Poverty Over the Age of 65 |
| Sioux | 0.0 /100 | #328 | Tragic 15.3% |
| Immigrants | Dominica | 0.0 /100 | #329 | Tragic 15.5% |
| Immigrants | St. Vincent and the Grenadines | 0.0 /100 | #330 | Tragic 15.5% |
| British West Indians | 0.0 /100 | #331 | Tragic 15.6% |
| Immigrants | Grenada | 0.0 /100 | #332 | Tragic 15.8% |
| Immigrants | Yemen | 0.0 /100 | #333 | Tragic 15.9% |
| Immigrants | Nicaragua | 0.0 /100 | #334 | Tragic 15.9% |
| Cubans | 0.0 /100 | #335 | Tragic 16.1% |
| Immigrants | Cabo Verde | 0.0 /100 | #336 | Tragic 16.2% |
| Immigrants | Caribbean | 0.0 /100 | #337 | Tragic 16.5% |
| Pueblo | 0.0 /100 | #338 | Tragic 17.2% |
| Navajo | 0.0 /100 | #339 | Tragic 17.5% |
| Hopi | 0.0 /100 | #340 | Tragic 17.8% |
| Dominicans | 0.0 /100 | #341 | Tragic 17.8% |
| Immigrants | Cuba | 0.0 /100 | #342 | Tragic 17.9% |