Immigrants from Somalia vs Immigrants from Senegal Unemployment Among Ages 60 to 64 years
COMPARE
Immigrants from Somalia
Immigrants from Senegal
Unemployment Among Ages 60 to 64 years
Unemployment Among Ages 60 to 64 years Comparison
Immigrants from Somalia
Immigrants from Senegal
4.6%
UNEMPLOYMENT AMONG AGES 60 TO 64 YEARS
99.2/ 100
METRIC RATING
77th/ 347
METRIC RANK
4.7%
UNEMPLOYMENT AMONG AGES 60 TO 64 YEARS
94.5/ 100
METRIC RATING
124th/ 347
METRIC RANK
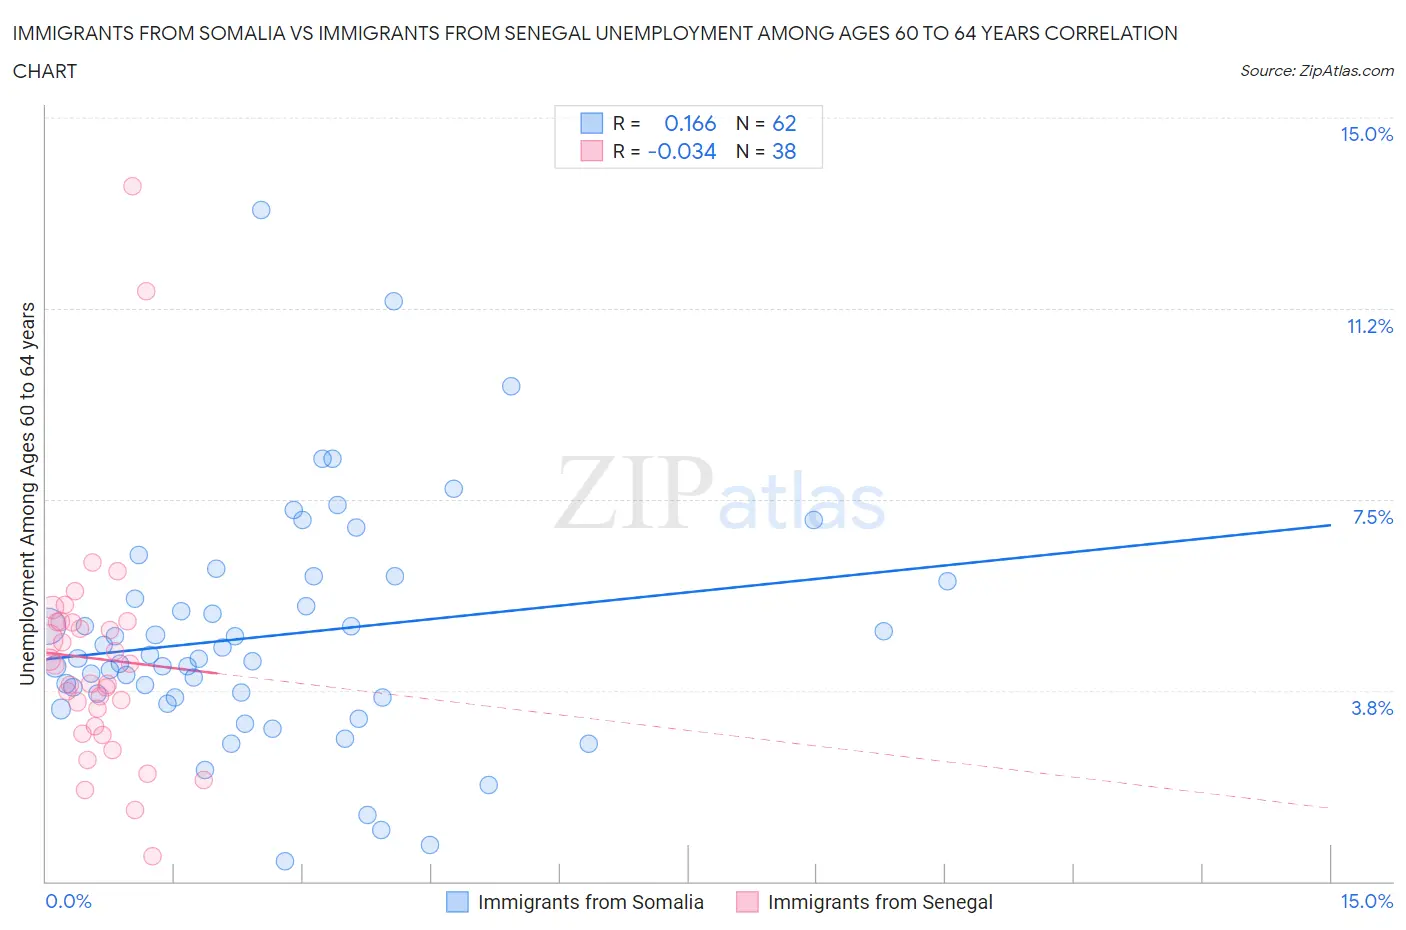
Immigrants from Somalia vs Immigrants from Senegal Unemployment Among Ages 60 to 64 years Correlation Chart
The statistical analysis conducted on geographies consisting of 89,602,853 people shows a poor positive correlation between the proportion of Immigrants from Somalia and unemployment rate among population between the ages 60 and 64 in the United States with a correlation coefficient (R) of 0.166 and weighted average of 4.6%. Similarly, the statistical analysis conducted on geographies consisting of 87,745,188 people shows no correlation between the proportion of Immigrants from Senegal and unemployment rate among population between the ages 60 and 64 in the United States with a correlation coefficient (R) of -0.034 and weighted average of 4.7%, a difference of 1.9%.
Unemployment Among Ages 60 to 64 years Correlation Summary
| Measurement | Immigrants from Somalia | Immigrants from Senegal |
| Minimum | 0.40% | 0.50% |
| Maximum | 13.2% | 13.7% |
| Range | 12.8% | 13.2% |
| Mean | 4.8% | 4.4% |
| Median | 4.4% | 4.1% |
| Interquartile 25% (IQ1) | 3.6% | 3.1% |
| Interquartile 75% (IQ3) | 5.9% | 5.1% |
| Interquartile Range (IQR) | 2.3% | 2.0% |
| Standard Deviation (Sample) | 2.3% | 2.4% |
| Standard Deviation (Population) | 2.3% | 2.4% |
Similar Demographics by Unemployment Among Ages 60 to 64 years
Demographics Similar to Immigrants from Somalia by Unemployment Among Ages 60 to 64 years
In terms of unemployment among ages 60 to 64 years, the demographic groups most similar to Immigrants from Somalia are Slovak (4.6%, a difference of 0.020%), Potawatomi (4.6%, a difference of 0.050%), Seminole (4.7%, a difference of 0.050%), Irish (4.7%, a difference of 0.080%), and Icelander (4.7%, a difference of 0.11%).
| Demographics | Rating | Rank | Unemployment Among Ages 60 to 64 years |
| Croatians | 99.5 /100 | #70 | Exceptional 4.6% |
| Slavs | 99.5 /100 | #71 | Exceptional 4.6% |
| Tongans | 99.5 /100 | #72 | Exceptional 4.6% |
| Immigrants | Eastern Africa | 99.5 /100 | #73 | Exceptional 4.6% |
| Northern Europeans | 99.3 /100 | #74 | Exceptional 4.6% |
| Potawatomi | 99.3 /100 | #75 | Exceptional 4.6% |
| Slovaks | 99.3 /100 | #76 | Exceptional 4.6% |
| Immigrants | Somalia | 99.2 /100 | #77 | Exceptional 4.6% |
| Seminole | 99.2 /100 | #78 | Exceptional 4.7% |
| Irish | 99.2 /100 | #79 | Exceptional 4.7% |
| Icelanders | 99.1 /100 | #80 | Exceptional 4.7% |
| Iroquois | 99.1 /100 | #81 | Exceptional 4.7% |
| Okinawans | 99.1 /100 | #82 | Exceptional 4.7% |
| Immigrants | Egypt | 99.1 /100 | #83 | Exceptional 4.7% |
| Thais | 98.9 /100 | #84 | Exceptional 4.7% |
Demographics Similar to Immigrants from Senegal by Unemployment Among Ages 60 to 64 years
In terms of unemployment among ages 60 to 64 years, the demographic groups most similar to Immigrants from Senegal are Finnish (4.7%, a difference of 0.030%), Immigrants from Kazakhstan (4.7%, a difference of 0.11%), Albanian (4.7%, a difference of 0.14%), Immigrants from Thailand (4.7%, a difference of 0.14%), and Macedonian (4.7%, a difference of 0.22%).
| Demographics | Rating | Rank | Unemployment Among Ages 60 to 64 years |
| Immigrants | Germany | 96.3 /100 | #117 | Exceptional 4.7% |
| Ukrainians | 96.1 /100 | #118 | Exceptional 4.7% |
| Immigrants | Morocco | 95.7 /100 | #119 | Exceptional 4.7% |
| Macedonians | 95.7 /100 | #120 | Exceptional 4.7% |
| Albanians | 95.3 /100 | #121 | Exceptional 4.7% |
| Immigrants | Kazakhstan | 95.1 /100 | #122 | Exceptional 4.7% |
| Finns | 94.7 /100 | #123 | Exceptional 4.7% |
| Immigrants | Senegal | 94.5 /100 | #124 | Exceptional 4.7% |
| Immigrants | Thailand | 93.7 /100 | #125 | Exceptional 4.7% |
| Immigrants | South Central Asia | 93.0 /100 | #126 | Exceptional 4.7% |
| Austrians | 91.9 /100 | #127 | Exceptional 4.8% |
| Choctaw | 90.3 /100 | #128 | Exceptional 4.8% |
| Immigrants | Serbia | 90.2 /100 | #129 | Exceptional 4.8% |
| Immigrants | Syria | 90.1 /100 | #130 | Exceptional 4.8% |
| Immigrants | Lebanon | 89.6 /100 | #131 | Excellent 4.8% |