Immigrants from Somalia vs Immigrants from Brazil Female Poverty Among 25-34 Year Olds
COMPARE
Immigrants from Somalia
Immigrants from Brazil
Female Poverty Among 25-34 Year Olds
Female Poverty Among 25-34 Year Olds Comparison
Immigrants from Somalia
Immigrants from Brazil
15.4%
FEMALE POVERTY AMONG 25-34 YEAR OLDS
0.1/ 100
METRIC RATING
266th/ 347
METRIC RANK
12.8%
FEMALE POVERTY AMONG 25-34 YEAR OLDS
93.3/ 100
METRIC RATING
115th/ 347
METRIC RANK
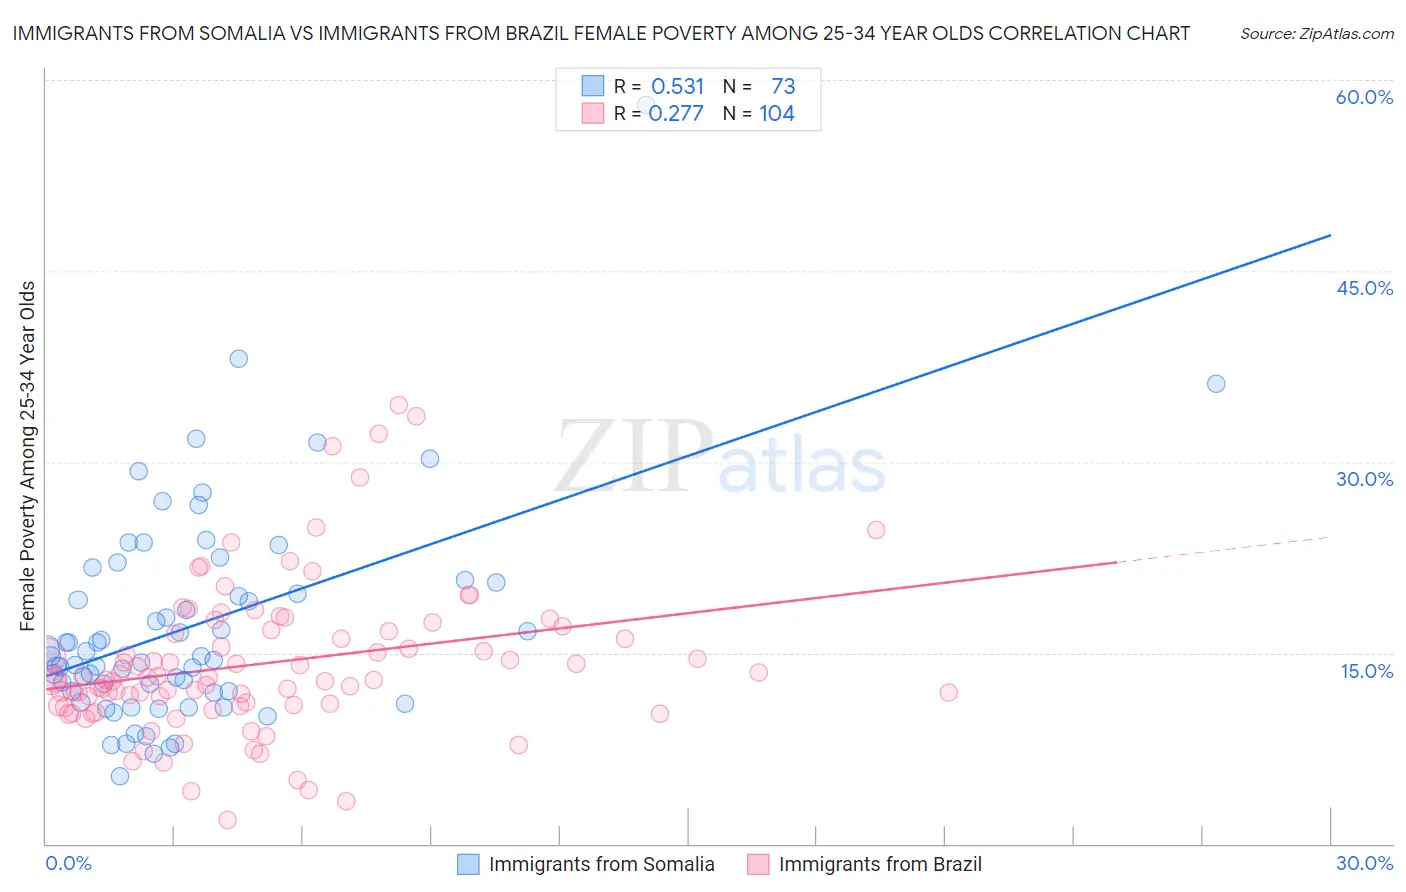
Immigrants from Somalia vs Immigrants from Brazil Female Poverty Among 25-34 Year Olds Correlation Chart
The statistical analysis conducted on geographies consisting of 91,786,624 people shows a substantial positive correlation between the proportion of Immigrants from Somalia and poverty level among females between the ages 25 and 34 in the United States with a correlation coefficient (R) of 0.531 and weighted average of 15.4%. Similarly, the statistical analysis conducted on geographies consisting of 338,129,930 people shows a weak positive correlation between the proportion of Immigrants from Brazil and poverty level among females between the ages 25 and 34 in the United States with a correlation coefficient (R) of 0.277 and weighted average of 12.8%, a difference of 20.6%.
Female Poverty Among 25-34 Year Olds Correlation Summary
| Measurement | Immigrants from Somalia | Immigrants from Brazil |
| Minimum | 5.3% | 1.9% |
| Maximum | 58.1% | 34.5% |
| Range | 52.7% | 32.6% |
| Mean | 17.1% | 14.2% |
| Median | 14.7% | 12.9% |
| Interquartile 25% (IQ1) | 11.9% | 10.9% |
| Interquartile 75% (IQ3) | 20.6% | 16.7% |
| Interquartile Range (IQR) | 8.7% | 5.9% |
| Standard Deviation (Sample) | 8.5% | 6.0% |
| Standard Deviation (Population) | 8.5% | 6.0% |
Similar Demographics by Female Poverty Among 25-34 Year Olds
Demographics Similar to Immigrants from Somalia by Female Poverty Among 25-34 Year Olds
In terms of female poverty among 25-34 year olds, the demographic groups most similar to Immigrants from Somalia are Immigrants from Liberia (15.4%, a difference of 0.010%), Pennsylvania German (15.4%, a difference of 0.040%), Central American (15.5%, a difference of 0.38%), Mexican American Indian (15.4%, a difference of 0.48%), and Immigrants from Belize (15.3%, a difference of 0.72%).
| Demographics | Rating | Rank | Female Poverty Among 25-34 Year Olds |
| Immigrants | Cuba | 0.2 /100 | #259 | Tragic 15.2% |
| Marshallese | 0.2 /100 | #260 | Tragic 15.3% |
| Liberians | 0.2 /100 | #261 | Tragic 15.3% |
| Immigrants | Belize | 0.2 /100 | #262 | Tragic 15.3% |
| Mexican American Indians | 0.2 /100 | #263 | Tragic 15.4% |
| Pennsylvania Germans | 0.1 /100 | #264 | Tragic 15.4% |
| Immigrants | Liberia | 0.1 /100 | #265 | Tragic 15.4% |
| Immigrants | Somalia | 0.1 /100 | #266 | Tragic 15.4% |
| Central Americans | 0.1 /100 | #267 | Tragic 15.5% |
| Immigrants | Senegal | 0.1 /100 | #268 | Tragic 15.6% |
| Sub-Saharan Africans | 0.1 /100 | #269 | Tragic 15.6% |
| British West Indians | 0.1 /100 | #270 | Tragic 15.6% |
| Cree | 0.1 /100 | #271 | Tragic 15.6% |
| Senegalese | 0.1 /100 | #272 | Tragic 15.6% |
| Immigrants | Nonimmigrants | 0.1 /100 | #273 | Tragic 15.6% |
Demographics Similar to Immigrants from Brazil by Female Poverty Among 25-34 Year Olds
In terms of female poverty among 25-34 year olds, the demographic groups most similar to Immigrants from Brazil are Chilean (12.8%, a difference of 0.030%), Immigrants from Southern Europe (12.8%, a difference of 0.090%), Immigrants from Kuwait (12.8%, a difference of 0.090%), Mongolian (12.8%, a difference of 0.10%), and Immigrants from Nepal (12.8%, a difference of 0.11%).
| Demographics | Rating | Rank | Female Poverty Among 25-34 Year Olds |
| Immigrants | Norway | 94.4 /100 | #108 | Exceptional 12.7% |
| Immigrants | Peru | 94.3 /100 | #109 | Exceptional 12.7% |
| Australians | 94.1 /100 | #110 | Exceptional 12.8% |
| Danes | 93.9 /100 | #111 | Exceptional 12.8% |
| Immigrants | Morocco | 93.9 /100 | #112 | Exceptional 12.8% |
| Immigrants | Syria | 93.8 /100 | #113 | Exceptional 12.8% |
| Immigrants | Southern Europe | 93.6 /100 | #114 | Exceptional 12.8% |
| Immigrants | Brazil | 93.3 /100 | #115 | Exceptional 12.8% |
| Chileans | 93.2 /100 | #116 | Exceptional 12.8% |
| Immigrants | Kuwait | 93.1 /100 | #117 | Exceptional 12.8% |
| Mongolians | 93.0 /100 | #118 | Exceptional 12.8% |
| Immigrants | Nepal | 93.0 /100 | #119 | Exceptional 12.8% |
| Carpatho Rusyns | 93.0 /100 | #120 | Exceptional 12.8% |
| Romanians | 92.8 /100 | #121 | Exceptional 12.8% |
| Immigrants | Western Asia | 92.7 /100 | #122 | Exceptional 12.8% |