Immigrants from Somalia vs Okinawan Female Poverty Among 25-34 Year Olds
COMPARE
Immigrants from Somalia
Okinawan
Female Poverty Among 25-34 Year Olds
Female Poverty Among 25-34 Year Olds Comparison
Immigrants from Somalia
Okinawans
15.4%
FEMALE POVERTY AMONG 25-34 YEAR OLDS
0.1/ 100
METRIC RATING
266th/ 347
METRIC RANK
11.3%
FEMALE POVERTY AMONG 25-34 YEAR OLDS
100.0/ 100
METRIC RATING
20th/ 347
METRIC RANK
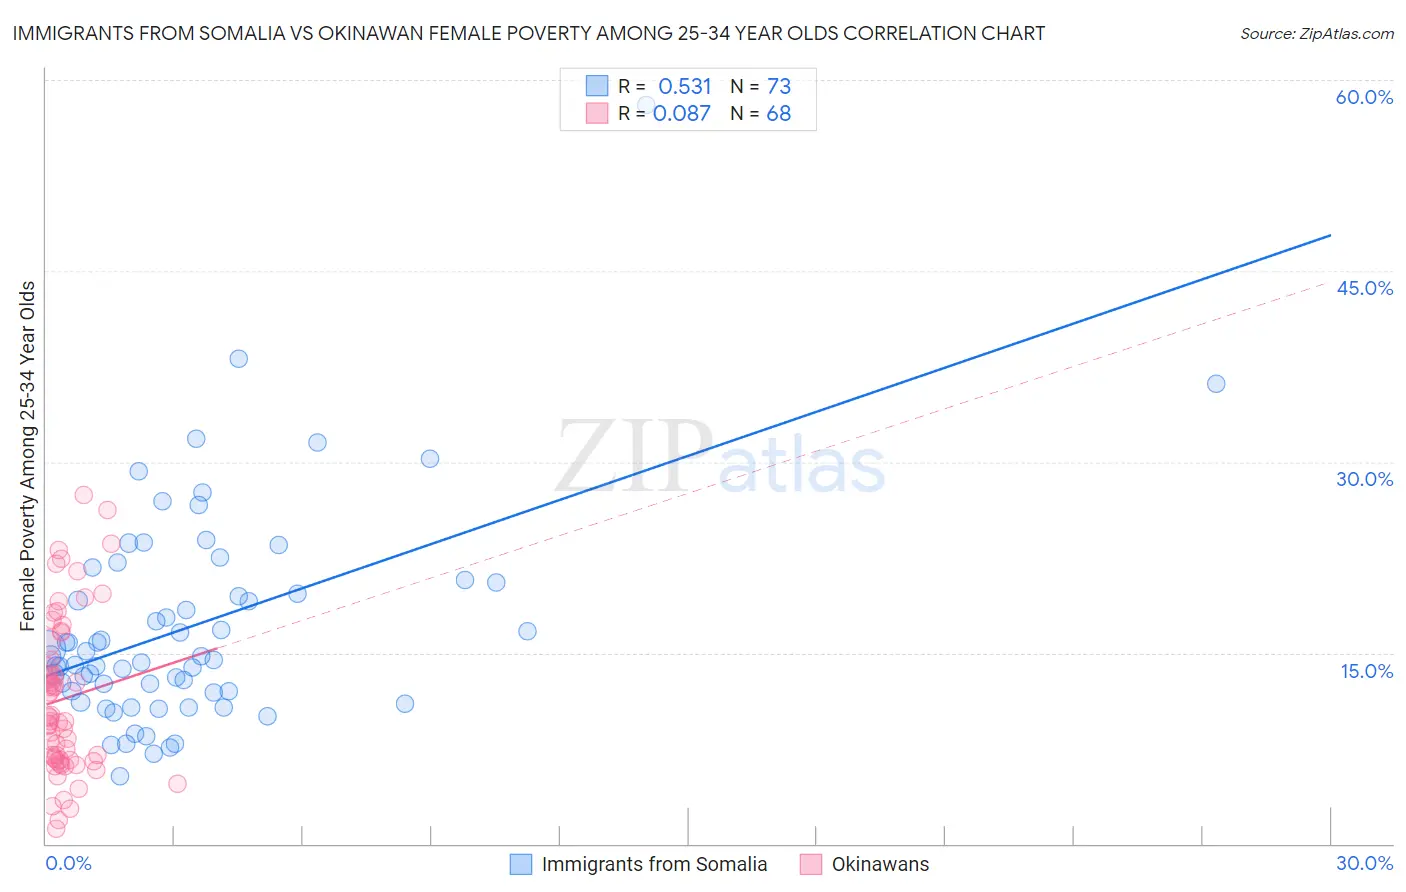
Immigrants from Somalia vs Okinawan Female Poverty Among 25-34 Year Olds Correlation Chart
The statistical analysis conducted on geographies consisting of 91,786,624 people shows a substantial positive correlation between the proportion of Immigrants from Somalia and poverty level among females between the ages 25 and 34 in the United States with a correlation coefficient (R) of 0.531 and weighted average of 15.4%. Similarly, the statistical analysis conducted on geographies consisting of 73,463,903 people shows a slight positive correlation between the proportion of Okinawans and poverty level among females between the ages 25 and 34 in the United States with a correlation coefficient (R) of 0.087 and weighted average of 11.3%, a difference of 36.4%.
Female Poverty Among 25-34 Year Olds Correlation Summary
| Measurement | Immigrants from Somalia | Okinawan |
| Minimum | 5.3% | 1.2% |
| Maximum | 58.1% | 27.4% |
| Range | 52.7% | 26.3% |
| Mean | 17.1% | 11.4% |
| Median | 14.7% | 9.8% |
| Interquartile 25% (IQ1) | 11.9% | 6.6% |
| Interquartile 75% (IQ3) | 20.6% | 15.1% |
| Interquartile Range (IQR) | 8.7% | 8.5% |
| Standard Deviation (Sample) | 8.5% | 6.2% |
| Standard Deviation (Population) | 8.5% | 6.1% |
Similar Demographics by Female Poverty Among 25-34 Year Olds
Demographics Similar to Immigrants from Somalia by Female Poverty Among 25-34 Year Olds
In terms of female poverty among 25-34 year olds, the demographic groups most similar to Immigrants from Somalia are Immigrants from Liberia (15.4%, a difference of 0.010%), Pennsylvania German (15.4%, a difference of 0.040%), Central American (15.5%, a difference of 0.38%), Mexican American Indian (15.4%, a difference of 0.48%), and Immigrants from Belize (15.3%, a difference of 0.72%).
| Demographics | Rating | Rank | Female Poverty Among 25-34 Year Olds |
| Immigrants | Cuba | 0.2 /100 | #259 | Tragic 15.2% |
| Marshallese | 0.2 /100 | #260 | Tragic 15.3% |
| Liberians | 0.2 /100 | #261 | Tragic 15.3% |
| Immigrants | Belize | 0.2 /100 | #262 | Tragic 15.3% |
| Mexican American Indians | 0.2 /100 | #263 | Tragic 15.4% |
| Pennsylvania Germans | 0.1 /100 | #264 | Tragic 15.4% |
| Immigrants | Liberia | 0.1 /100 | #265 | Tragic 15.4% |
| Immigrants | Somalia | 0.1 /100 | #266 | Tragic 15.4% |
| Central Americans | 0.1 /100 | #267 | Tragic 15.5% |
| Immigrants | Senegal | 0.1 /100 | #268 | Tragic 15.6% |
| Sub-Saharan Africans | 0.1 /100 | #269 | Tragic 15.6% |
| British West Indians | 0.1 /100 | #270 | Tragic 15.6% |
| Cree | 0.1 /100 | #271 | Tragic 15.6% |
| Senegalese | 0.1 /100 | #272 | Tragic 15.6% |
| Immigrants | Nonimmigrants | 0.1 /100 | #273 | Tragic 15.6% |
Demographics Similar to Okinawans by Female Poverty Among 25-34 Year Olds
In terms of female poverty among 25-34 year olds, the demographic groups most similar to Okinawans are Iranian (11.2%, a difference of 0.72%), Turkish (11.4%, a difference of 0.77%), Immigrants from Eastern Asia (11.2%, a difference of 0.86%), Asian (11.4%, a difference of 0.93%), and Immigrants from China (11.2%, a difference of 0.97%).
| Demographics | Rating | Rank | Female Poverty Among 25-34 Year Olds |
| Burmese | 100.0 /100 | #13 | Exceptional 11.2% |
| Indians (Asian) | 100.0 /100 | #14 | Exceptional 11.2% |
| Assyrians/Chaldeans/Syriacs | 100.0 /100 | #15 | Exceptional 11.2% |
| Immigrants | Bolivia | 100.0 /100 | #16 | Exceptional 11.2% |
| Immigrants | China | 100.0 /100 | #17 | Exceptional 11.2% |
| Immigrants | Eastern Asia | 100.0 /100 | #18 | Exceptional 11.2% |
| Iranians | 100.0 /100 | #19 | Exceptional 11.2% |
| Okinawans | 100.0 /100 | #20 | Exceptional 11.3% |
| Turks | 100.0 /100 | #21 | Exceptional 11.4% |
| Asians | 99.9 /100 | #22 | Exceptional 11.4% |
| Bolivians | 99.9 /100 | #23 | Exceptional 11.4% |
| Maltese | 99.9 /100 | #24 | Exceptional 11.4% |
| Bhutanese | 99.9 /100 | #25 | Exceptional 11.4% |
| Tongans | 99.9 /100 | #26 | Exceptional 11.5% |
| Immigrants | Greece | 99.9 /100 | #27 | Exceptional 11.5% |