Immigrants from Panama vs Immigrants from Brazil Female Poverty Among 25-34 Year Olds
COMPARE
Immigrants from Panama
Immigrants from Brazil
Female Poverty Among 25-34 Year Olds
Female Poverty Among 25-34 Year Olds Comparison
Immigrants from Panama
Immigrants from Brazil
14.1%
FEMALE POVERTY AMONG 25-34 YEAR OLDS
11.6/ 100
METRIC RATING
208th/ 347
METRIC RANK
12.8%
FEMALE POVERTY AMONG 25-34 YEAR OLDS
93.3/ 100
METRIC RATING
115th/ 347
METRIC RANK
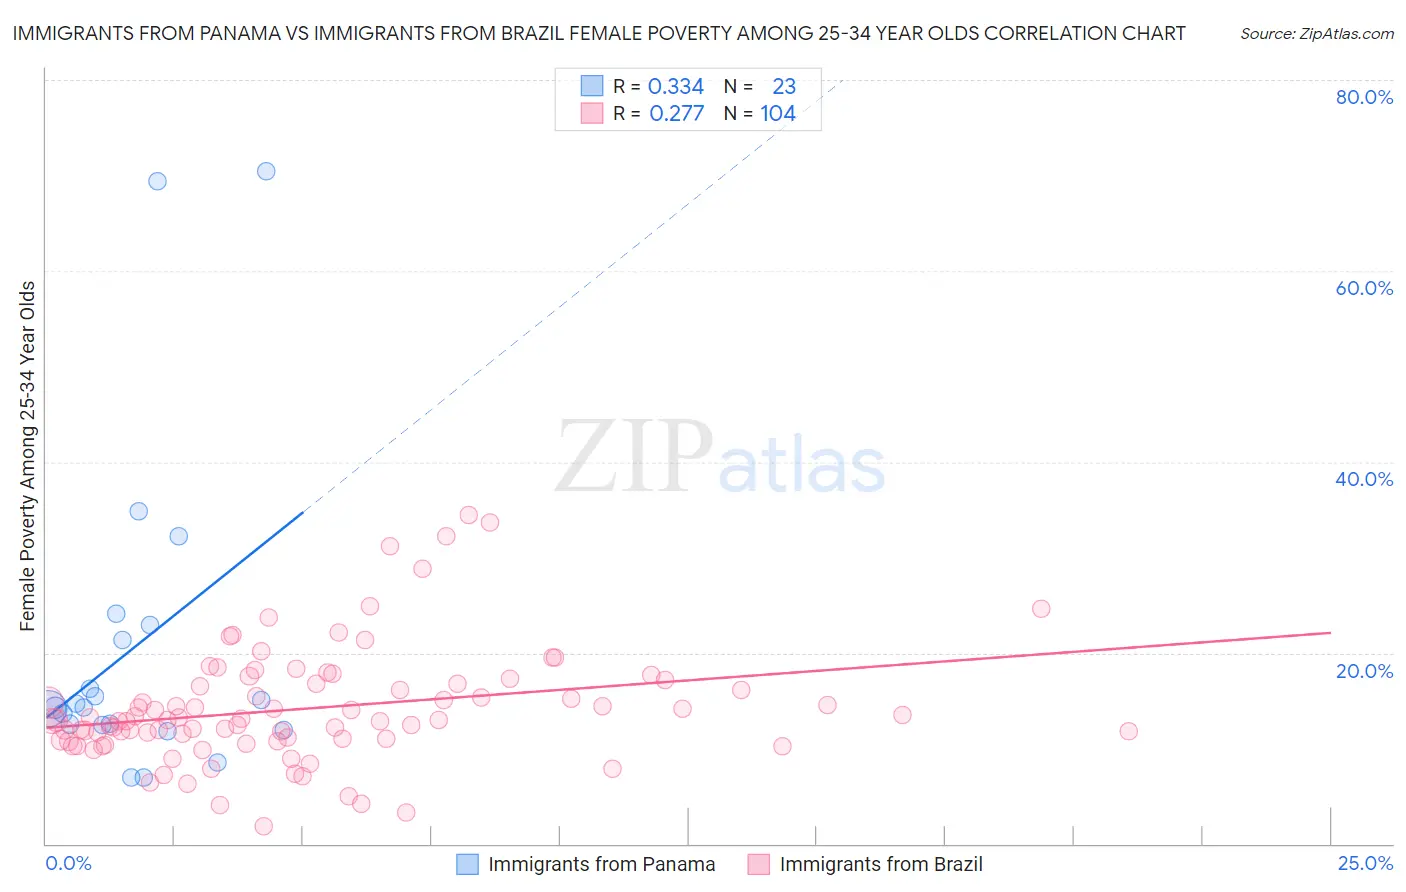
Immigrants from Panama vs Immigrants from Brazil Female Poverty Among 25-34 Year Olds Correlation Chart
The statistical analysis conducted on geographies consisting of 219,926,572 people shows a mild positive correlation between the proportion of Immigrants from Panama and poverty level among females between the ages 25 and 34 in the United States with a correlation coefficient (R) of 0.334 and weighted average of 14.1%. Similarly, the statistical analysis conducted on geographies consisting of 338,129,930 people shows a weak positive correlation between the proportion of Immigrants from Brazil and poverty level among females between the ages 25 and 34 in the United States with a correlation coefficient (R) of 0.277 and weighted average of 12.8%, a difference of 10.3%.
Female Poverty Among 25-34 Year Olds Correlation Summary
| Measurement | Immigrants from Panama | Immigrants from Brazil |
| Minimum | 7.0% | 1.9% |
| Maximum | 70.5% | 34.5% |
| Range | 63.5% | 32.6% |
| Mean | 20.7% | 14.2% |
| Median | 14.3% | 12.9% |
| Interquartile 25% (IQ1) | 12.4% | 10.9% |
| Interquartile 75% (IQ3) | 22.9% | 16.7% |
| Interquartile Range (IQR) | 10.5% | 5.9% |
| Standard Deviation (Sample) | 17.0% | 6.0% |
| Standard Deviation (Population) | 16.7% | 6.0% |
Similar Demographics by Female Poverty Among 25-34 Year Olds
Demographics Similar to Immigrants from Panama by Female Poverty Among 25-34 Year Olds
In terms of female poverty among 25-34 year olds, the demographic groups most similar to Immigrants from Panama are Japanese (14.1%, a difference of 0.020%), Hungarian (14.1%, a difference of 0.040%), Immigrants from Africa (14.1%, a difference of 0.32%), Hawaiian (14.1%, a difference of 0.37%), and Immigrants (14.0%, a difference of 0.51%).
| Demographics | Rating | Rank | Female Poverty Among 25-34 Year Olds |
| Immigrants | Trinidad and Tobago | 17.6 /100 | #201 | Poor 14.0% |
| Welsh | 17.2 /100 | #202 | Poor 14.0% |
| Immigrants | Immigrants | 14.5 /100 | #203 | Poor 14.0% |
| Hawaiians | 13.6 /100 | #204 | Poor 14.1% |
| Immigrants | Africa | 13.4 /100 | #205 | Poor 14.1% |
| Hungarians | 11.8 /100 | #206 | Poor 14.1% |
| Japanese | 11.7 /100 | #207 | Poor 14.1% |
| Immigrants | Panama | 11.6 /100 | #208 | Poor 14.1% |
| Guyanese | 8.6 /100 | #209 | Tragic 14.2% |
| Panamanians | 8.6 /100 | #210 | Tragic 14.2% |
| Trinidadians and Tobagonians | 8.2 /100 | #211 | Tragic 14.2% |
| Immigrants | Guyana | 6.6 /100 | #212 | Tragic 14.3% |
| Puget Sound Salish | 6.5 /100 | #213 | Tragic 14.3% |
| French | 6.2 /100 | #214 | Tragic 14.3% |
| Immigrants | Nigeria | 6.2 /100 | #215 | Tragic 14.3% |
Demographics Similar to Immigrants from Brazil by Female Poverty Among 25-34 Year Olds
In terms of female poverty among 25-34 year olds, the demographic groups most similar to Immigrants from Brazil are Chilean (12.8%, a difference of 0.030%), Immigrants from Southern Europe (12.8%, a difference of 0.090%), Immigrants from Kuwait (12.8%, a difference of 0.090%), Mongolian (12.8%, a difference of 0.10%), and Immigrants from Nepal (12.8%, a difference of 0.11%).
| Demographics | Rating | Rank | Female Poverty Among 25-34 Year Olds |
| Immigrants | Norway | 94.4 /100 | #108 | Exceptional 12.7% |
| Immigrants | Peru | 94.3 /100 | #109 | Exceptional 12.7% |
| Australians | 94.1 /100 | #110 | Exceptional 12.8% |
| Danes | 93.9 /100 | #111 | Exceptional 12.8% |
| Immigrants | Morocco | 93.9 /100 | #112 | Exceptional 12.8% |
| Immigrants | Syria | 93.8 /100 | #113 | Exceptional 12.8% |
| Immigrants | Southern Europe | 93.6 /100 | #114 | Exceptional 12.8% |
| Immigrants | Brazil | 93.3 /100 | #115 | Exceptional 12.8% |
| Chileans | 93.2 /100 | #116 | Exceptional 12.8% |
| Immigrants | Kuwait | 93.1 /100 | #117 | Exceptional 12.8% |
| Mongolians | 93.0 /100 | #118 | Exceptional 12.8% |
| Immigrants | Nepal | 93.0 /100 | #119 | Exceptional 12.8% |
| Carpatho Rusyns | 93.0 /100 | #120 | Exceptional 12.8% |
| Romanians | 92.8 /100 | #121 | Exceptional 12.8% |
| Immigrants | Western Asia | 92.7 /100 | #122 | Exceptional 12.8% |