Immigrants from Somalia vs German Russian Female Poverty Among 25-34 Year Olds
COMPARE
Immigrants from Somalia
German Russian
Female Poverty Among 25-34 Year Olds
Female Poverty Among 25-34 Year Olds Comparison
Immigrants from Somalia
German Russians
15.4%
FEMALE POVERTY AMONG 25-34 YEAR OLDS
0.1/ 100
METRIC RATING
266th/ 347
METRIC RANK
14.9%
FEMALE POVERTY AMONG 25-34 YEAR OLDS
0.8/ 100
METRIC RATING
247th/ 347
METRIC RANK
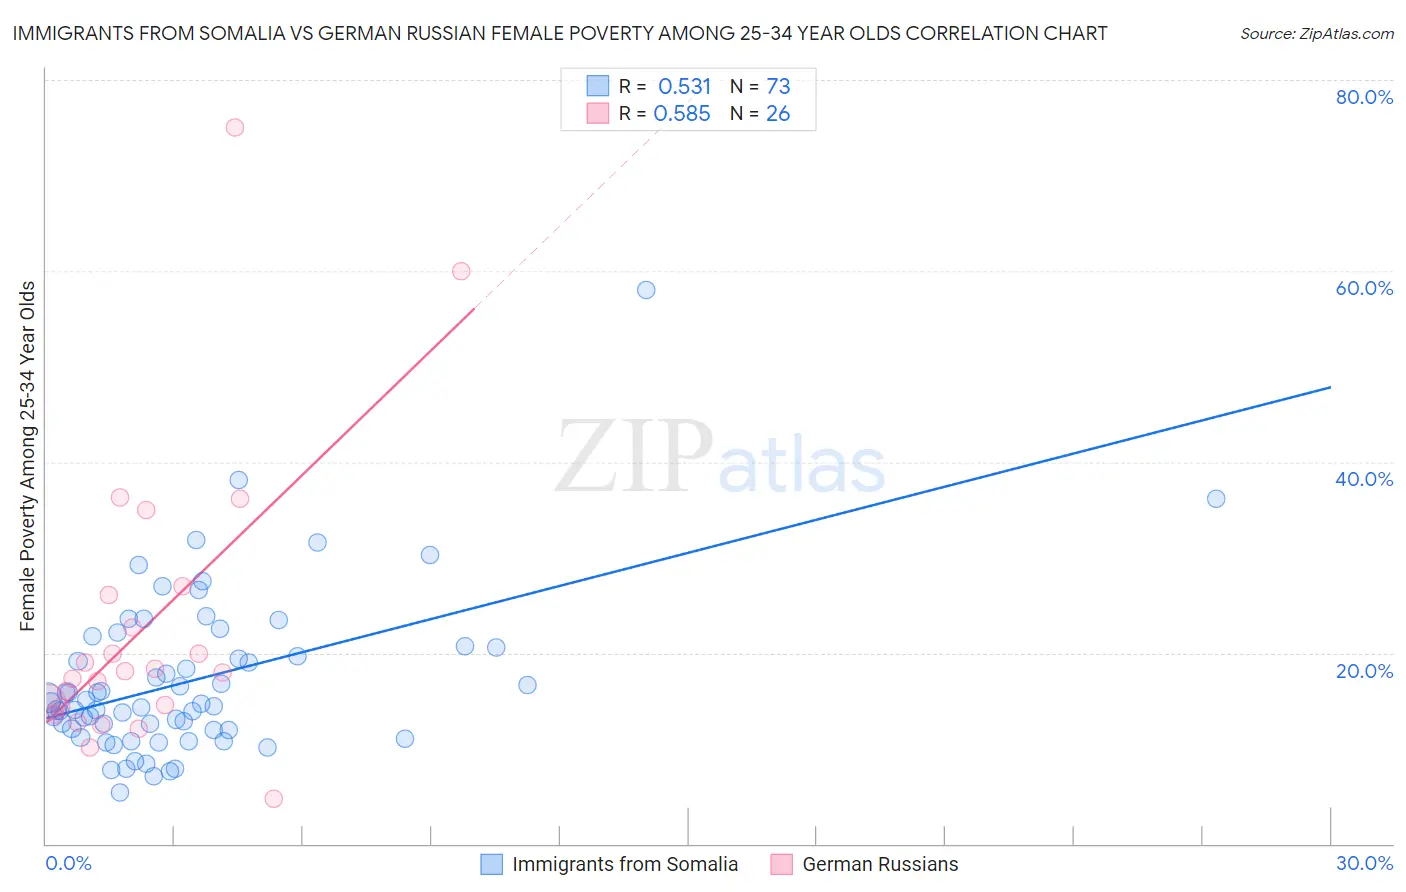
Immigrants from Somalia vs German Russian Female Poverty Among 25-34 Year Olds Correlation Chart
The statistical analysis conducted on geographies consisting of 91,786,624 people shows a substantial positive correlation between the proportion of Immigrants from Somalia and poverty level among females between the ages 25 and 34 in the United States with a correlation coefficient (R) of 0.531 and weighted average of 15.4%. Similarly, the statistical analysis conducted on geographies consisting of 96,128,428 people shows a substantial positive correlation between the proportion of German Russians and poverty level among females between the ages 25 and 34 in the United States with a correlation coefficient (R) of 0.585 and weighted average of 14.9%, a difference of 3.7%.
Female Poverty Among 25-34 Year Olds Correlation Summary
| Measurement | Immigrants from Somalia | German Russian |
| Minimum | 5.3% | 4.7% |
| Maximum | 58.1% | 75.0% |
| Range | 52.7% | 70.3% |
| Mean | 17.1% | 22.7% |
| Median | 14.7% | 18.0% |
| Interquartile 25% (IQ1) | 11.9% | 14.3% |
| Interquartile 75% (IQ3) | 20.6% | 26.1% |
| Interquartile Range (IQR) | 8.7% | 11.8% |
| Standard Deviation (Sample) | 8.5% | 15.4% |
| Standard Deviation (Population) | 8.5% | 15.1% |
Demographics Similar to Immigrants from Somalia and German Russians by Female Poverty Among 25-34 Year Olds
In terms of female poverty among 25-34 year olds, the demographic groups most similar to Immigrants from Somalia are Immigrants from Liberia (15.4%, a difference of 0.010%), Pennsylvania German (15.4%, a difference of 0.040%), Mexican American Indian (15.4%, a difference of 0.48%), Immigrants from Belize (15.3%, a difference of 0.72%), and Liberian (15.3%, a difference of 0.76%). Similarly, the demographic groups most similar to German Russians are Immigrants from Western Africa (14.9%, a difference of 0.040%), Jamaican (14.8%, a difference of 0.34%), Immigrants from Haiti (15.0%, a difference of 0.87%), Immigrants from El Salvador (15.0%, a difference of 0.90%), and Haitian (15.0%, a difference of 1.1%).
| Demographics | Rating | Rank | Female Poverty Among 25-34 Year Olds |
| Jamaicans | 1.0 /100 | #246 | Tragic 14.8% |
| German Russians | 0.8 /100 | #247 | Tragic 14.9% |
| Immigrants | Western Africa | 0.8 /100 | #248 | Tragic 14.9% |
| Immigrants | Haiti | 0.5 /100 | #249 | Tragic 15.0% |
| Immigrants | El Salvador | 0.5 /100 | #250 | Tragic 15.0% |
| Haitians | 0.5 /100 | #251 | Tragic 15.0% |
| Belizeans | 0.4 /100 | #252 | Tragic 15.1% |
| Immigrants | West Indies | 0.4 /100 | #253 | Tragic 15.1% |
| Somalis | 0.4 /100 | #254 | Tragic 15.1% |
| Immigrants | Laos | 0.3 /100 | #255 | Tragic 15.2% |
| West Indians | 0.3 /100 | #256 | Tragic 15.2% |
| Immigrants | Burma/Myanmar | 0.3 /100 | #257 | Tragic 15.2% |
| Nepalese | 0.2 /100 | #258 | Tragic 15.2% |
| Immigrants | Cuba | 0.2 /100 | #259 | Tragic 15.2% |
| Marshallese | 0.2 /100 | #260 | Tragic 15.3% |
| Liberians | 0.2 /100 | #261 | Tragic 15.3% |
| Immigrants | Belize | 0.2 /100 | #262 | Tragic 15.3% |
| Mexican American Indians | 0.2 /100 | #263 | Tragic 15.4% |
| Pennsylvania Germans | 0.1 /100 | #264 | Tragic 15.4% |
| Immigrants | Liberia | 0.1 /100 | #265 | Tragic 15.4% |
| Immigrants | Somalia | 0.1 /100 | #266 | Tragic 15.4% |