Immigrants from Dominica vs Swedish Family Poverty
COMPARE
Immigrants from Dominica
Swedish
Family Poverty
Family Poverty Comparison
Immigrants from Dominica
Swedes
12.7%
FAMILY POVERTY
0.0/ 100
METRIC RATING
324th/ 347
METRIC RANK
7.1%
FAMILY POVERTY
99.8/ 100
METRIC RATING
13th/ 347
METRIC RANK
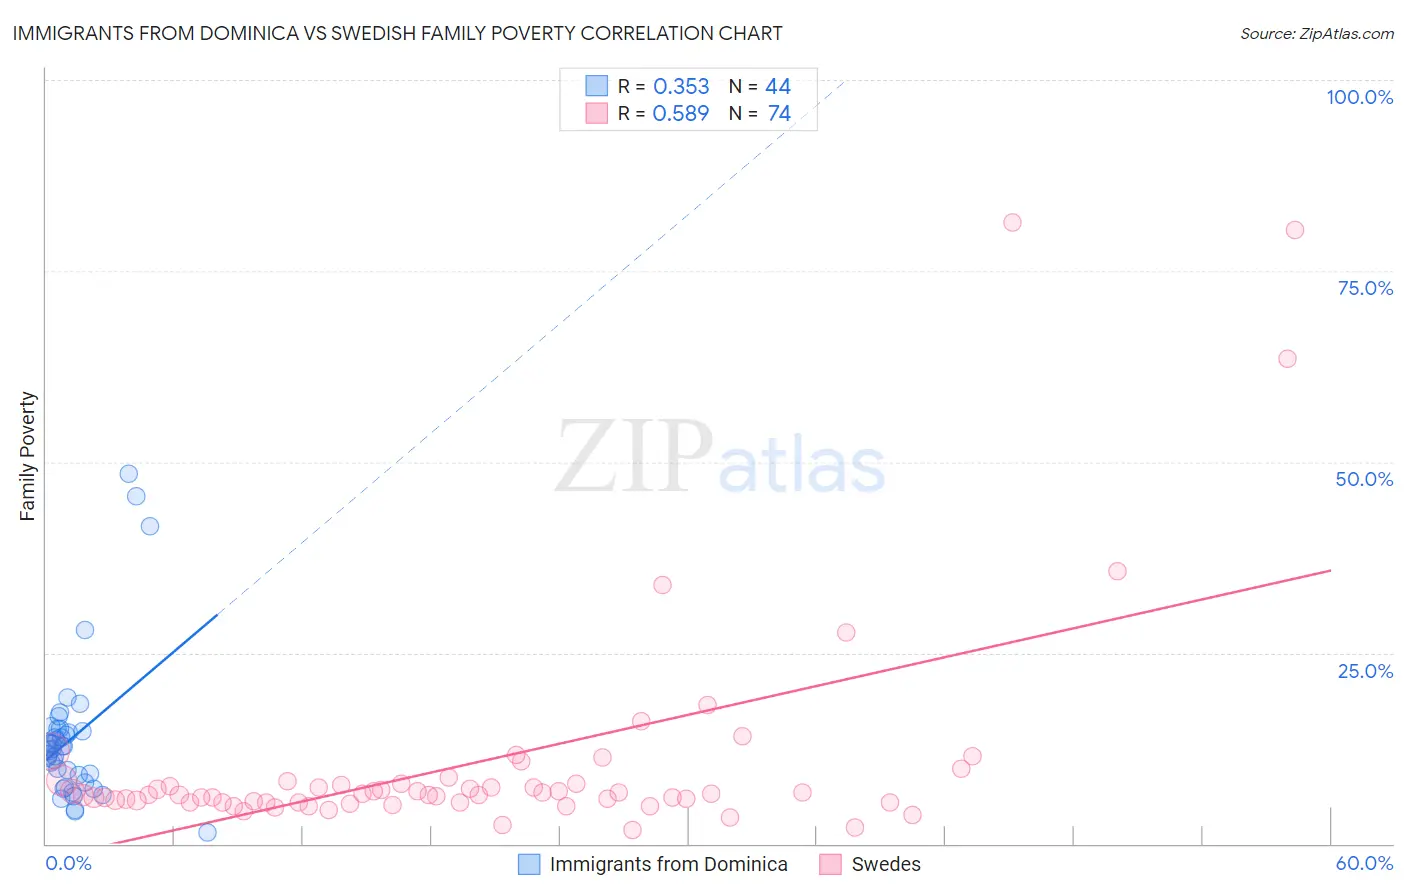
Immigrants from Dominica vs Swedish Family Poverty Correlation Chart
The statistical analysis conducted on geographies consisting of 83,762,031 people shows a mild positive correlation between the proportion of Immigrants from Dominica and poverty level among families in the United States with a correlation coefficient (R) of 0.353 and weighted average of 12.7%. Similarly, the statistical analysis conducted on geographies consisting of 535,382,987 people shows a substantial positive correlation between the proportion of Swedes and poverty level among families in the United States with a correlation coefficient (R) of 0.589 and weighted average of 7.1%, a difference of 78.9%.
Family Poverty Correlation Summary
| Measurement | Immigrants from Dominica | Swedish |
| Minimum | 1.5% | 1.8% |
| Maximum | 48.5% | 81.3% |
| Range | 47.0% | 79.6% |
| Mean | 14.0% | 10.7% |
| Median | 12.7% | 6.5% |
| Interquartile 25% (IQ1) | 8.5% | 5.4% |
| Interquartile 75% (IQ3) | 14.9% | 7.9% |
| Interquartile Range (IQR) | 6.3% | 2.5% |
| Standard Deviation (Sample) | 9.8% | 14.6% |
| Standard Deviation (Population) | 9.6% | 14.5% |
Similar Demographics by Family Poverty
Demographics Similar to Immigrants from Dominica by Family Poverty
In terms of family poverty, the demographic groups most similar to Immigrants from Dominica are Menominee (12.7%, a difference of 0.080%), Immigrants from Honduras (12.7%, a difference of 0.62%), Arapaho (12.7%, a difference of 0.72%), Paiute (13.0%, a difference of 2.0%), and Colville (13.0%, a difference of 2.0%).
| Demographics | Rating | Rank | Family Poverty |
| Immigrants | Grenada | 0.0 /100 | #317 | Tragic 12.4% |
| U.S. Virgin Islanders | 0.0 /100 | #318 | Tragic 12.4% |
| British West Indians | 0.0 /100 | #319 | Tragic 12.4% |
| Inupiat | 0.0 /100 | #320 | Tragic 12.5% |
| Arapaho | 0.0 /100 | #321 | Tragic 12.7% |
| Immigrants | Honduras | 0.0 /100 | #322 | Tragic 12.7% |
| Menominee | 0.0 /100 | #323 | Tragic 12.7% |
| Immigrants | Dominica | 0.0 /100 | #324 | Tragic 12.7% |
| Paiute | 0.0 /100 | #325 | Tragic 13.0% |
| Colville | 0.0 /100 | #326 | Tragic 13.0% |
| Yakama | 0.0 /100 | #327 | Tragic 13.1% |
| Central American Indians | 0.0 /100 | #328 | Tragic 13.3% |
| Blacks/African Americans | 0.0 /100 | #329 | Tragic 13.3% |
| Natives/Alaskans | 0.0 /100 | #330 | Tragic 14.3% |
| Cheyenne | 0.0 /100 | #331 | Tragic 14.3% |
Demographics Similar to Swedes by Family Poverty
In terms of family poverty, the demographic groups most similar to Swedes are Iranian (7.1%, a difference of 0.010%), Maltese (7.1%, a difference of 0.050%), Immigrants from Singapore (7.1%, a difference of 0.34%), Bulgarian (7.1%, a difference of 0.35%), and Latvian (7.1%, a difference of 0.60%).
| Demographics | Rating | Rank | Family Poverty |
| Norwegians | 99.9 /100 | #6 | Exceptional 6.9% |
| Immigrants | Ireland | 99.9 /100 | #7 | Exceptional 7.0% |
| Bhutanese | 99.9 /100 | #8 | Exceptional 7.0% |
| Latvians | 99.9 /100 | #9 | Exceptional 7.1% |
| Bulgarians | 99.8 /100 | #10 | Exceptional 7.1% |
| Immigrants | Singapore | 99.8 /100 | #11 | Exceptional 7.1% |
| Maltese | 99.8 /100 | #12 | Exceptional 7.1% |
| Swedes | 99.8 /100 | #13 | Exceptional 7.1% |
| Iranians | 99.8 /100 | #14 | Exceptional 7.1% |
| Lithuanians | 99.8 /100 | #15 | Exceptional 7.2% |
| Immigrants | South Central Asia | 99.8 /100 | #16 | Exceptional 7.2% |
| Luxembourgers | 99.8 /100 | #17 | Exceptional 7.2% |
| Immigrants | Lithuania | 99.8 /100 | #18 | Exceptional 7.2% |
| Eastern Europeans | 99.7 /100 | #19 | Exceptional 7.2% |
| Immigrants | Hong Kong | 99.7 /100 | #20 | Exceptional 7.3% |