Immigrants from Sierra Leone vs Immigrants from Southern Europe Female Poverty Among 18-24 Year Olds
COMPARE
Immigrants from Sierra Leone
Immigrants from Southern Europe
Female Poverty Among 18-24 Year Olds
Female Poverty Among 18-24 Year Olds Comparison
Immigrants from Sierra Leone
Immigrants from Southern Europe
19.2%
FEMALE POVERTY AMONG 18-24 YEAR OLDS
97.8/ 100
METRIC RATING
106th/ 347
METRIC RANK
18.2%
FEMALE POVERTY AMONG 18-24 YEAR OLDS
100.0/ 100
METRIC RATING
46th/ 347
METRIC RANK
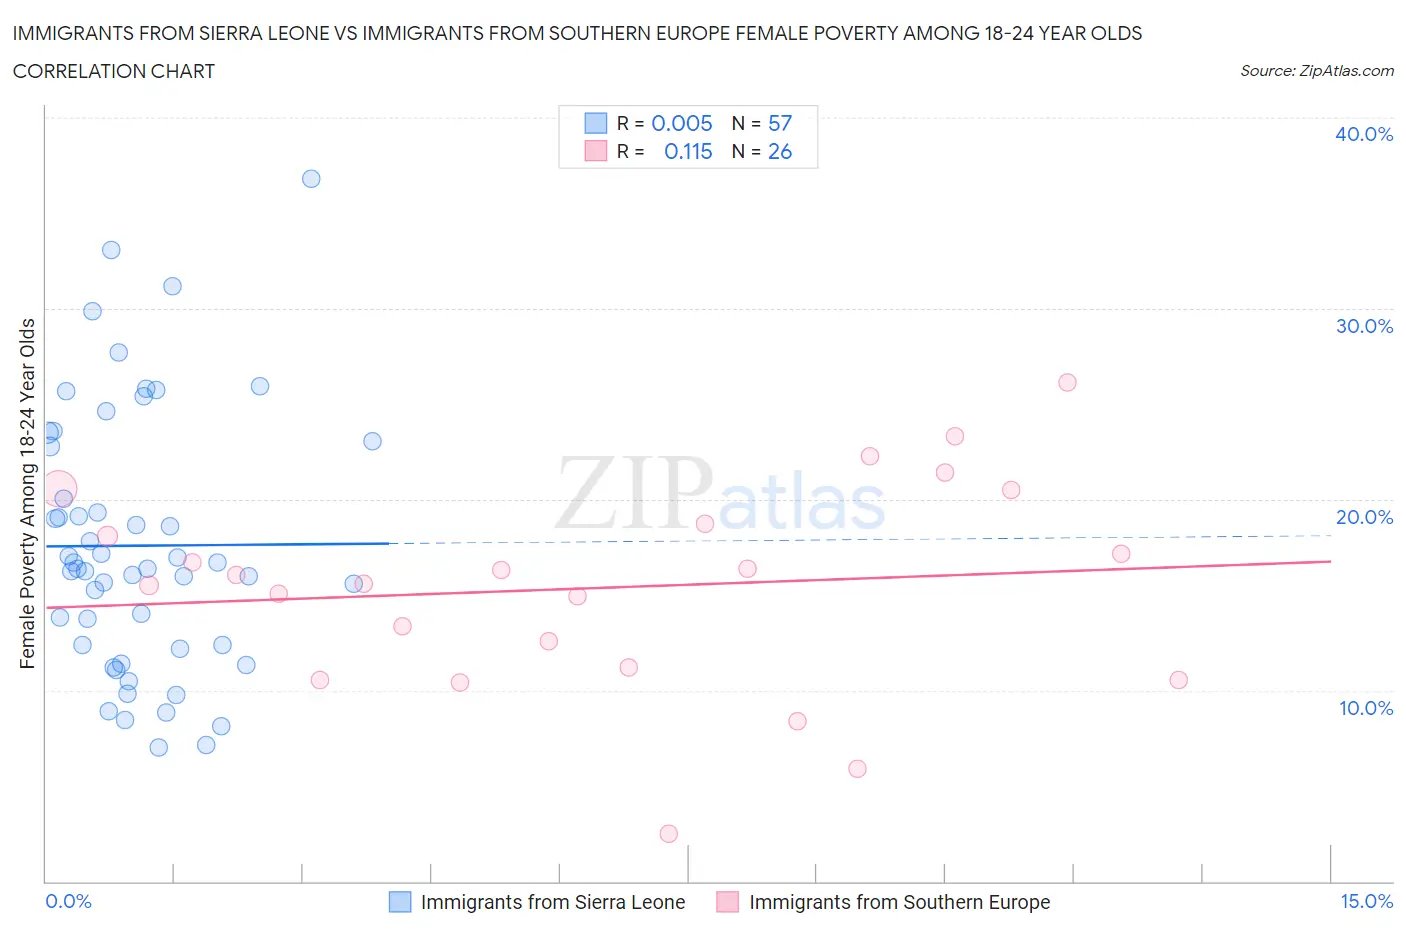
Immigrants from Sierra Leone vs Immigrants from Southern Europe Female Poverty Among 18-24 Year Olds Correlation Chart
The statistical analysis conducted on geographies consisting of 100,931,142 people shows no correlation between the proportion of Immigrants from Sierra Leone and poverty level among females between the ages 18 and 24 in the United States with a correlation coefficient (R) of 0.005 and weighted average of 19.2%. Similarly, the statistical analysis conducted on geographies consisting of 389,452,737 people shows a poor positive correlation between the proportion of Immigrants from Southern Europe and poverty level among females between the ages 18 and 24 in the United States with a correlation coefficient (R) of 0.115 and weighted average of 18.2%, a difference of 5.5%.
Female Poverty Among 18-24 Year Olds Correlation Summary
| Measurement | Immigrants from Sierra Leone | Immigrants from Southern Europe |
| Minimum | 7.0% | 2.5% |
| Maximum | 36.8% | 26.1% |
| Range | 29.8% | 23.6% |
| Mean | 17.6% | 15.4% |
| Median | 16.4% | 15.8% |
| Interquartile 25% (IQ1) | 12.3% | 11.2% |
| Interquartile 75% (IQ3) | 22.9% | 18.7% |
| Interquartile Range (IQR) | 10.6% | 7.5% |
| Standard Deviation (Sample) | 6.8% | 5.5% |
| Standard Deviation (Population) | 6.8% | 5.4% |
Similar Demographics by Female Poverty Among 18-24 Year Olds
Demographics Similar to Immigrants from Sierra Leone by Female Poverty Among 18-24 Year Olds
In terms of female poverty among 18-24 year olds, the demographic groups most similar to Immigrants from Sierra Leone are Immigrants from Ecuador (19.2%, a difference of 0.040%), Immigrants from Afghanistan (19.1%, a difference of 0.12%), Immigrants from Sri Lanka (19.2%, a difference of 0.15%), Serbian (19.1%, a difference of 0.16%), and Immigrants from Caribbean (19.1%, a difference of 0.20%).
| Demographics | Rating | Rank | Female Poverty Among 18-24 Year Olds |
| Immigrants | Czechoslovakia | 98.3 /100 | #99 | Exceptional 19.1% |
| Chileans | 98.3 /100 | #100 | Exceptional 19.1% |
| Ecuadorians | 98.1 /100 | #101 | Exceptional 19.1% |
| Immigrants | Caribbean | 98.1 /100 | #102 | Exceptional 19.1% |
| Serbians | 98.0 /100 | #103 | Exceptional 19.1% |
| Immigrants | Afghanistan | 98.0 /100 | #104 | Exceptional 19.1% |
| Immigrants | Ecuador | 97.8 /100 | #105 | Exceptional 19.2% |
| Immigrants | Sierra Leone | 97.8 /100 | #106 | Exceptional 19.2% |
| Immigrants | Sri Lanka | 97.5 /100 | #107 | Exceptional 19.2% |
| Immigrants | Uzbekistan | 97.3 /100 | #108 | Exceptional 19.2% |
| Immigrants | Syria | 97.2 /100 | #109 | Exceptional 19.2% |
| Laotians | 97.1 /100 | #110 | Exceptional 19.2% |
| Immigrants | Serbia | 97.1 /100 | #111 | Exceptional 19.2% |
| Immigrants | El Salvador | 96.5 /100 | #112 | Exceptional 19.3% |
| Immigrants | Cameroon | 96.3 /100 | #113 | Exceptional 19.3% |
Demographics Similar to Immigrants from Southern Europe by Female Poverty Among 18-24 Year Olds
In terms of female poverty among 18-24 year olds, the demographic groups most similar to Immigrants from Southern Europe are Asian (18.2%, a difference of 0.080%), Sri Lankan (18.2%, a difference of 0.13%), Bhutanese (18.2%, a difference of 0.16%), Samoan (18.2%, a difference of 0.27%), and Spanish American Indian (18.1%, a difference of 0.28%).
| Demographics | Rating | Rank | Female Poverty Among 18-24 Year Olds |
| Puget Sound Salish | 100.0 /100 | #39 | Exceptional 18.0% |
| Immigrants | Romania | 100.0 /100 | #40 | Exceptional 18.0% |
| Immigrants | Argentina | 100.0 /100 | #41 | Exceptional 18.0% |
| Bulgarians | 100.0 /100 | #42 | Exceptional 18.1% |
| Macedonians | 100.0 /100 | #43 | Exceptional 18.1% |
| Nicaraguans | 100.0 /100 | #44 | Exceptional 18.1% |
| Spanish American Indians | 100.0 /100 | #45 | Exceptional 18.1% |
| Immigrants | Southern Europe | 100.0 /100 | #46 | Exceptional 18.2% |
| Asians | 100.0 /100 | #47 | Exceptional 18.2% |
| Sri Lankans | 100.0 /100 | #48 | Exceptional 18.2% |
| Bhutanese | 100.0 /100 | #49 | Exceptional 18.2% |
| Samoans | 100.0 /100 | #50 | Exceptional 18.2% |
| Immigrants | Eastern Europe | 99.9 /100 | #51 | Exceptional 18.2% |
| Immigrants | Ireland | 99.9 /100 | #52 | Exceptional 18.3% |
| Italians | 99.9 /100 | #53 | Exceptional 18.3% |