Immigrants from Sierra Leone vs Immigrants from Eastern Europe Single Mother Poverty
COMPARE
Immigrants from Sierra Leone
Immigrants from Eastern Europe
Single Mother Poverty
Single Mother Poverty Comparison
Immigrants from Sierra Leone
Immigrants from Eastern Europe
26.9%
SINGLE MOTHER POVERTY
99.9/ 100
METRIC RATING
44th/ 347
METRIC RANK
27.2%
SINGLE MOTHER POVERTY
99.6/ 100
METRIC RATING
61st/ 347
METRIC RANK
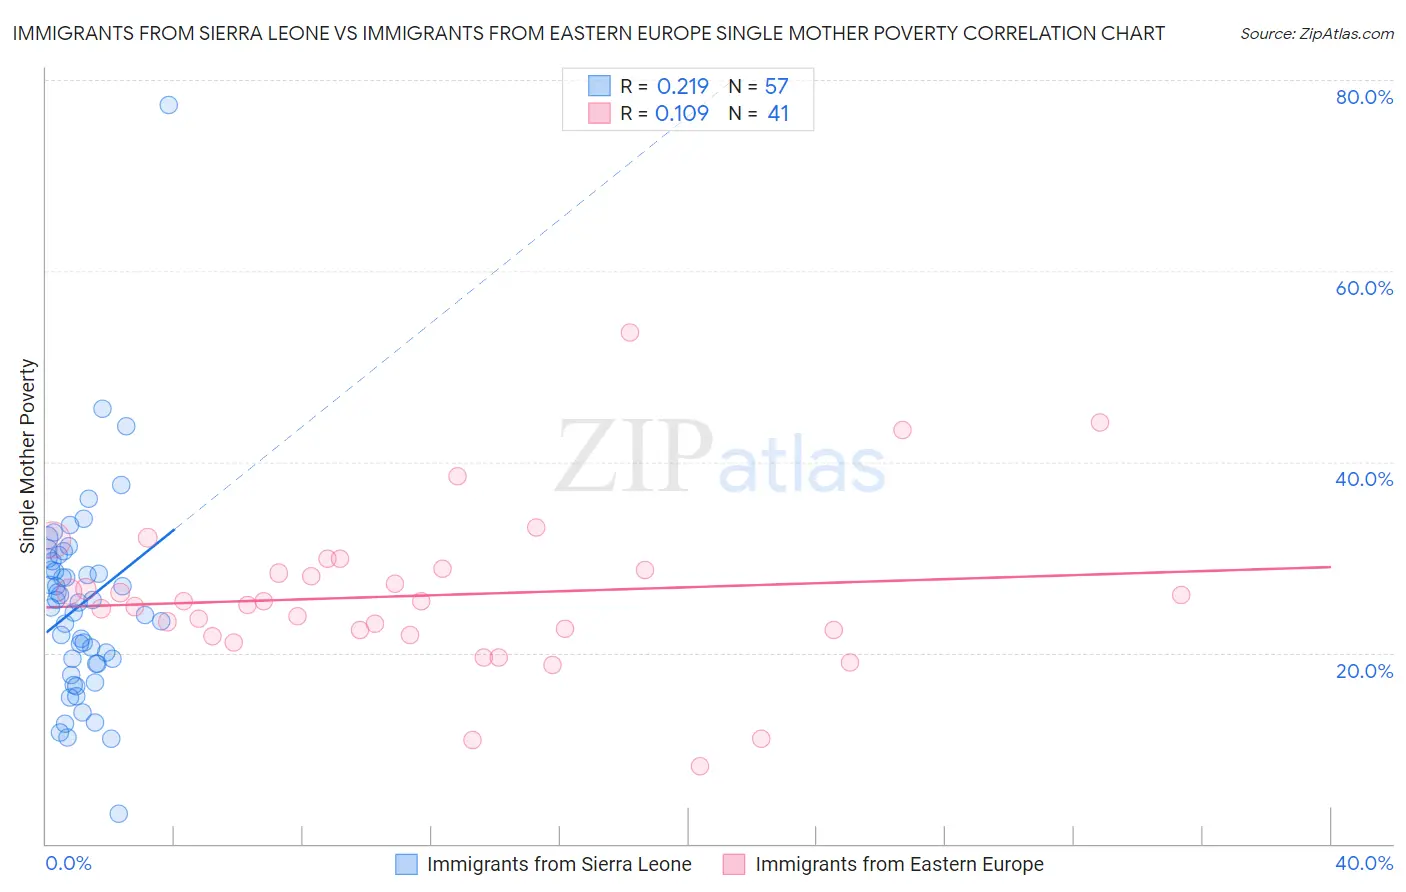
Immigrants from Sierra Leone vs Immigrants from Eastern Europe Single Mother Poverty Correlation Chart
The statistical analysis conducted on geographies consisting of 101,102,212 people shows a weak positive correlation between the proportion of Immigrants from Sierra Leone and poverty level among single mothers in the United States with a correlation coefficient (R) of 0.219 and weighted average of 26.9%. Similarly, the statistical analysis conducted on geographies consisting of 458,466,379 people shows a poor positive correlation between the proportion of Immigrants from Eastern Europe and poverty level among single mothers in the United States with a correlation coefficient (R) of 0.109 and weighted average of 27.2%, a difference of 1.4%.
Single Mother Poverty Correlation Summary
| Measurement | Immigrants from Sierra Leone | Immigrants from Eastern Europe |
| Minimum | 3.1% | 8.1% |
| Maximum | 77.3% | 53.6% |
| Range | 74.2% | 45.5% |
| Mean | 25.1% | 26.0% |
| Median | 25.2% | 25.4% |
| Interquartile 25% (IQ1) | 18.9% | 22.1% |
| Interquartile 75% (IQ3) | 29.7% | 28.7% |
| Interquartile Range (IQR) | 10.9% | 6.6% |
| Standard Deviation (Sample) | 10.8% | 8.4% |
| Standard Deviation (Population) | 10.7% | 8.3% |
Demographics Similar to Immigrants from Sierra Leone and Immigrants from Eastern Europe by Single Mother Poverty
In terms of single mother poverty, the demographic groups most similar to Immigrants from Sierra Leone are Latvian (26.9%, a difference of 0.070%), Immigrants from Serbia (26.9%, a difference of 0.12%), Tsimshian (26.8%, a difference of 0.14%), Egyptian (26.9%, a difference of 0.18%), and Armenian (26.8%, a difference of 0.22%). Similarly, the demographic groups most similar to Immigrants from Eastern Europe are Eastern European (27.2%, a difference of 0.11%), Immigrants from Malaysia (27.3%, a difference of 0.14%), Paraguayan (27.2%, a difference of 0.15%), Argentinean (27.2%, a difference of 0.16%), and Palestinian (27.2%, a difference of 0.32%).
| Demographics | Rating | Rank | Single Mother Poverty |
| Armenians | 99.9 /100 | #42 | Exceptional 26.8% |
| Tsimshian | 99.9 /100 | #43 | Exceptional 26.8% |
| Immigrants | Sierra Leone | 99.9 /100 | #44 | Exceptional 26.9% |
| Latvians | 99.9 /100 | #45 | Exceptional 26.9% |
| Immigrants | Serbia | 99.9 /100 | #46 | Exceptional 26.9% |
| Egyptians | 99.8 /100 | #47 | Exceptional 26.9% |
| Immigrants | Poland | 99.8 /100 | #48 | Exceptional 26.9% |
| Cambodians | 99.8 /100 | #49 | Exceptional 27.0% |
| Laotians | 99.8 /100 | #50 | Exceptional 27.0% |
| Immigrants | Argentina | 99.7 /100 | #51 | Exceptional 27.1% |
| Immigrants | South Eastern Asia | 99.7 /100 | #52 | Exceptional 27.1% |
| Immigrants | Jordan | 99.7 /100 | #53 | Exceptional 27.1% |
| Immigrants | Bulgaria | 99.7 /100 | #54 | Exceptional 27.1% |
| Immigrants | Egypt | 99.7 /100 | #55 | Exceptional 27.1% |
| Immigrants | Romania | 99.7 /100 | #56 | Exceptional 27.2% |
| Palestinians | 99.7 /100 | #57 | Exceptional 27.2% |
| Argentineans | 99.6 /100 | #58 | Exceptional 27.2% |
| Paraguayans | 99.6 /100 | #59 | Exceptional 27.2% |
| Eastern Europeans | 99.6 /100 | #60 | Exceptional 27.2% |
| Immigrants | Eastern Europe | 99.6 /100 | #61 | Exceptional 27.2% |
| Immigrants | Malaysia | 99.5 /100 | #62 | Exceptional 27.3% |