Immigrants from Sierra Leone vs Immigrants from Denmark Child Poverty Among Girls Under 16
COMPARE
Immigrants from Sierra Leone
Immigrants from Denmark
Child Poverty Among Girls Under 16
Child Poverty Among Girls Under 16 Comparison
Immigrants from Sierra Leone
Immigrants from Denmark
17.2%
CHILD POVERTY AMONG GIRLS UNDER 16
17.6/ 100
METRIC RATING
202nd/ 347
METRIC RANK
15.2%
CHILD POVERTY AMONG GIRLS UNDER 16
93.3/ 100
METRIC RATING
116th/ 347
METRIC RANK
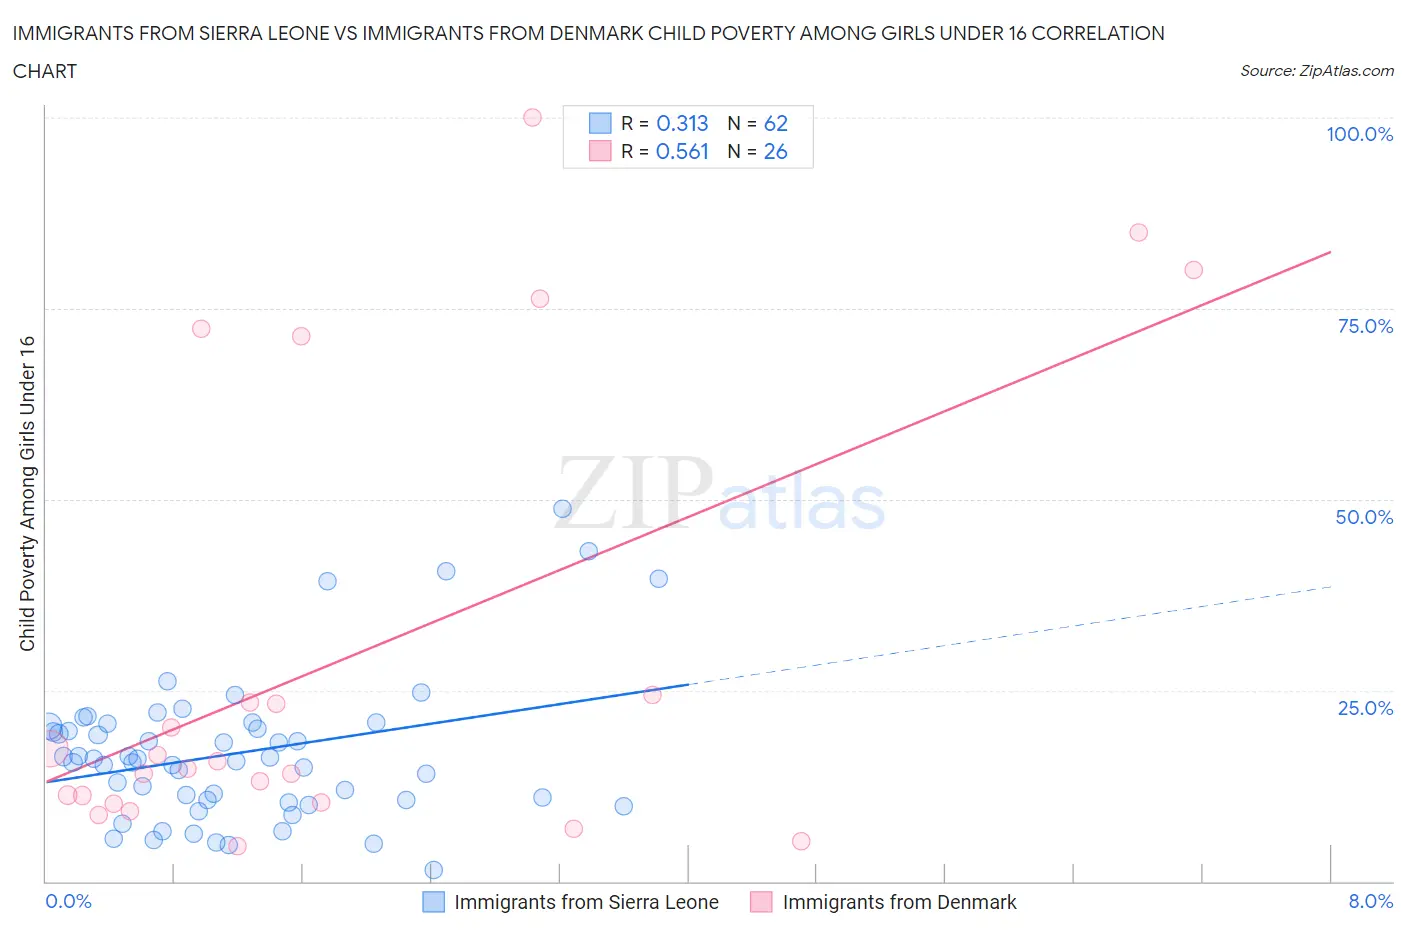
Immigrants from Sierra Leone vs Immigrants from Denmark Child Poverty Among Girls Under 16 Correlation Chart
The statistical analysis conducted on geographies consisting of 101,382,968 people shows a mild positive correlation between the proportion of Immigrants from Sierra Leone and poverty level among girls under the age of 16 in the United States with a correlation coefficient (R) of 0.313 and weighted average of 17.2%. Similarly, the statistical analysis conducted on geographies consisting of 135,139,155 people shows a substantial positive correlation between the proportion of Immigrants from Denmark and poverty level among girls under the age of 16 in the United States with a correlation coefficient (R) of 0.561 and weighted average of 15.2%, a difference of 13.0%.
Child Poverty Among Girls Under 16 Correlation Summary
| Measurement | Immigrants from Sierra Leone | Immigrants from Denmark |
| Minimum | 1.4% | 4.6% |
| Maximum | 48.7% | 100.0% |
| Range | 47.3% | 95.4% |
| Mean | 16.8% | 29.2% |
| Median | 15.9% | 15.3% |
| Interquartile 25% (IQ1) | 10.6% | 10.3% |
| Interquartile 75% (IQ3) | 20.4% | 24.4% |
| Interquartile Range (IQR) | 9.8% | 14.1% |
| Standard Deviation (Sample) | 9.6% | 29.7% |
| Standard Deviation (Population) | 9.5% | 29.1% |
Similar Demographics by Child Poverty Among Girls Under 16
Demographics Similar to Immigrants from Sierra Leone by Child Poverty Among Girls Under 16
In terms of child poverty among girls under 16, the demographic groups most similar to Immigrants from Sierra Leone are Ugandan (17.2%, a difference of 0.010%), Immigrants from Kenya (17.2%, a difference of 0.050%), Immigrants from Uzbekistan (17.1%, a difference of 0.69%), Immigrants from Afghanistan (17.1%, a difference of 0.84%), and Immigrants from Lebanon (17.1%, a difference of 0.87%).
| Demographics | Rating | Rank | Child Poverty Among Girls Under 16 |
| Immigrants | Costa Rica | 25.6 /100 | #195 | Fair 17.0% |
| Celtics | 25.2 /100 | #196 | Fair 17.0% |
| Spaniards | 24.9 /100 | #197 | Fair 17.0% |
| Immigrants | Lebanon | 22.6 /100 | #198 | Fair 17.1% |
| Immigrants | Afghanistan | 22.4 /100 | #199 | Fair 17.1% |
| Immigrants | Uzbekistan | 21.5 /100 | #200 | Fair 17.1% |
| Immigrants | Kenya | 17.8 /100 | #201 | Poor 17.2% |
| Immigrants | Sierra Leone | 17.6 /100 | #202 | Poor 17.2% |
| Ugandans | 17.5 /100 | #203 | Poor 17.2% |
| Iraqis | 13.0 /100 | #204 | Poor 17.4% |
| Immigrants | Cameroon | 12.6 /100 | #205 | Poor 17.4% |
| Delaware | 11.5 /100 | #206 | Poor 17.4% |
| Hmong | 10.6 /100 | #207 | Poor 17.5% |
| Sierra Leoneans | 8.9 /100 | #208 | Tragic 17.6% |
| Panamanians | 8.7 /100 | #209 | Tragic 17.6% |
Demographics Similar to Immigrants from Denmark by Child Poverty Among Girls Under 16
In terms of child poverty among girls under 16, the demographic groups most similar to Immigrants from Denmark are Immigrants from North Macedonia (15.2%, a difference of 0.090%), Immigrants from Southern Europe (15.3%, a difference of 0.28%), Belgian (15.2%, a difference of 0.31%), Sri Lankan (15.2%, a difference of 0.38%), and Immigrants from Zimbabwe (15.3%, a difference of 0.38%).
| Demographics | Rating | Rank | Child Poverty Among Girls Under 16 |
| Serbians | 94.8 /100 | #109 | Exceptional 15.1% |
| Immigrants | Croatia | 94.6 /100 | #110 | Exceptional 15.1% |
| Palestinians | 94.5 /100 | #111 | Exceptional 15.1% |
| Immigrants | Kazakhstan | 94.3 /100 | #112 | Exceptional 15.1% |
| Dutch | 94.3 /100 | #113 | Exceptional 15.1% |
| Sri Lankans | 94.0 /100 | #114 | Exceptional 15.2% |
| Belgians | 93.9 /100 | #115 | Exceptional 15.2% |
| Immigrants | Denmark | 93.3 /100 | #116 | Exceptional 15.2% |
| Immigrants | North Macedonia | 93.1 /100 | #117 | Exceptional 15.2% |
| Immigrants | Southern Europe | 92.7 /100 | #118 | Exceptional 15.3% |
| Immigrants | Zimbabwe | 92.5 /100 | #119 | Exceptional 15.3% |
| Pakistanis | 92.3 /100 | #120 | Exceptional 15.3% |
| English | 92.2 /100 | #121 | Exceptional 15.3% |
| Portuguese | 91.8 /100 | #122 | Exceptional 15.3% |
| Irish | 91.5 /100 | #123 | Exceptional 15.3% |