Immigrants from Senegal vs Immigrants from Belize Male Poverty
COMPARE
Immigrants from Senegal
Immigrants from Belize
Male Poverty
Male Poverty Comparison
Immigrants from Senegal
Immigrants from Belize
14.0%
MALE POVERTY
0.0/ 100
METRIC RATING
301st/ 347
METRIC RANK
13.8%
MALE POVERTY
0.0/ 100
METRIC RATING
293rd/ 347
METRIC RANK
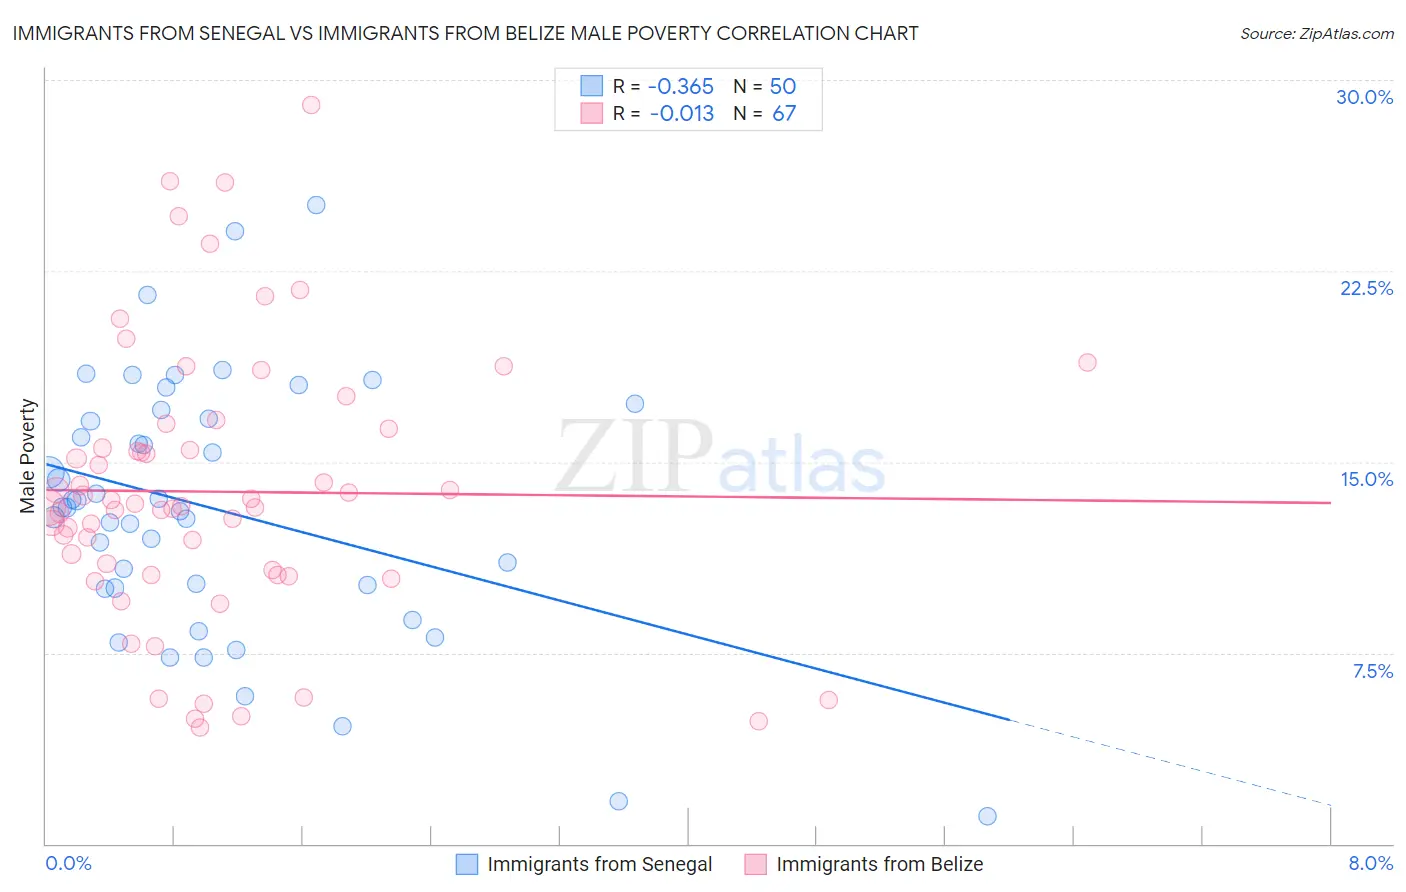
Immigrants from Senegal vs Immigrants from Belize Male Poverty Correlation Chart
The statistical analysis conducted on geographies consisting of 90,120,671 people shows a mild negative correlation between the proportion of Immigrants from Senegal and poverty level among males in the United States with a correlation coefficient (R) of -0.365 and weighted average of 14.0%. Similarly, the statistical analysis conducted on geographies consisting of 130,288,128 people shows no correlation between the proportion of Immigrants from Belize and poverty level among males in the United States with a correlation coefficient (R) of -0.013 and weighted average of 13.8%, a difference of 1.4%.
Male Poverty Correlation Summary
| Measurement | Immigrants from Senegal | Immigrants from Belize |
| Minimum | 1.1% | 4.6% |
| Maximum | 25.1% | 29.0% |
| Range | 24.0% | 24.4% |
| Mean | 13.1% | 13.8% |
| Median | 13.2% | 13.2% |
| Interquartile 25% (IQ1) | 10.0% | 10.6% |
| Interquartile 75% (IQ3) | 16.7% | 16.3% |
| Interquartile Range (IQR) | 6.7% | 5.7% |
| Standard Deviation (Sample) | 5.1% | 5.4% |
| Standard Deviation (Population) | 5.0% | 5.3% |
Demographics Similar to Immigrants from Senegal and Immigrants from Belize by Male Poverty
In terms of male poverty, the demographic groups most similar to Immigrants from Senegal are Immigrants from Caribbean (14.0%, a difference of 0.060%), Immigrants from Mexico (14.0%, a difference of 0.070%), Bahamian (14.1%, a difference of 0.10%), Immigrants from Guatemala (14.0%, a difference of 0.18%), and Senegalese (14.1%, a difference of 0.20%). Similarly, the demographic groups most similar to Immigrants from Belize are Indonesian (13.8%, a difference of 0.010%), Hispanic or Latino (13.9%, a difference of 0.060%), Vietnamese (13.8%, a difference of 0.18%), Guatemalan (13.8%, a difference of 0.27%), and Immigrants from Zaire (13.8%, a difference of 0.27%).
| Demographics | Rating | Rank | Male Poverty |
| Immigrants | Barbados | 0.0 /100 | #287 | Tragic 13.8% |
| Immigrants | St. Vincent and the Grenadines | 0.0 /100 | #288 | Tragic 13.8% |
| Guatemalans | 0.0 /100 | #289 | Tragic 13.8% |
| Immigrants | Zaire | 0.0 /100 | #290 | Tragic 13.8% |
| Vietnamese | 0.0 /100 | #291 | Tragic 13.8% |
| Indonesians | 0.0 /100 | #292 | Tragic 13.8% |
| Immigrants | Belize | 0.0 /100 | #293 | Tragic 13.8% |
| Hispanics or Latinos | 0.0 /100 | #294 | Tragic 13.9% |
| Immigrants | Central America | 0.0 /100 | #295 | Tragic 13.9% |
| Cajuns | 0.0 /100 | #296 | Tragic 13.9% |
| Inupiat | 0.0 /100 | #297 | Tragic 14.0% |
| Blackfeet | 0.0 /100 | #298 | Tragic 14.0% |
| Immigrants | Guatemala | 0.0 /100 | #299 | Tragic 14.0% |
| Immigrants | Mexico | 0.0 /100 | #300 | Tragic 14.0% |
| Immigrants | Senegal | 0.0 /100 | #301 | Tragic 14.0% |
| Immigrants | Caribbean | 0.0 /100 | #302 | Tragic 14.0% |
| Bahamians | 0.0 /100 | #303 | Tragic 14.1% |
| Senegalese | 0.0 /100 | #304 | Tragic 14.1% |
| Immigrants | Bangladesh | 0.0 /100 | #305 | Tragic 14.1% |
| Creek | 0.0 /100 | #306 | Tragic 14.1% |
| Dutch West Indians | 0.0 /100 | #307 | Tragic 14.2% |