Estonian vs Immigrants from Europe Seniors Poverty Over the Age of 65

COMPARE

Estonian
Race
Ancestry
AfghanAfricanAlaska NativeAlaskan AthabascanAlbanianAleutAlsatianAmericanApacheArabArapahoArgentineanArmenianAssyrian/Chaldean/SyriacAustralianAustrianBahamianBangladeshiBarbadianBasqueBelgianBelizeanBermudanBhutaneseBlackfeetBolivianBrazilianBritishBritish West IndianBulgarianBurmeseCajunCambodianCanadianCape VerdeanCarpatho RusynCelticCentral AmericanCentral American IndianCherokeeCheyenneChickasawChileanChineseChippewaChoctawColombianColvilleComancheCosta RicanCreeCreekCroatianCrowCubanCypriotCzechCzechoslovakianDanishDelawareDominicanDutchDutch West IndianEastern EuropeanEcuadorianEgyptianEnglishEstonianEthiopianEuropeanFijianFilipinoFinnishFrenchFrench American IndianFrench CanadianGermanGerman RussianGhanaianGreekGuamanian/ChamorroGuatemalanGuyaneseHaitianHmongHonduranHopiHoumaHungarianIcelanderIndian (Asian)IndonesianInupiatIranianIraqiIrishIroquoisIsraeliItalianJamaicanJapaneseJordanianKenyanKiowaKoreanLaotianLatvianLebaneseLiberianLithuanianLumbeeLuxembourgerMacedonianMalaysianMalteseMarshalleseMenomineeMexicanMexican American IndianMongolianMoroccanNative HawaiianNavajoNepaleseNew ZealanderNicaraguanNigerianNorthern EuropeanNorwegianOkinawanOsageOttawaPaiutePakistaniPalestinianPanamanianParaguayanPennsylvania GermanPeruvianPimaPolishPortuguesePotawatomiPuebloPuerto RicanPuget Sound SalishRomanianRussianSalvadoranSamoanScandinavianScotch-IrishScottishSeminoleSenegaleseSerbianShoshoneSierra LeoneanSiouxSlavicSlovakSloveneSomaliSouth AfricanSouth AmericanSouth American IndianSoviet UnionSpaniardSpanishSpanish AmericanSpanish American IndianSri LankanSubsaharan AfricanSudaneseSwedishSwissSyrianTaiwaneseThaiTlingit-HaidaTohono O'OdhamTonganTrinidadian and TobagonianTsimshianTurkishU.S. Virgin IslanderUgandanUkrainianUruguayanUteVenezuelanVietnameseWelshWest IndianYakamaYaquiYugoslavianYumanYup'ikZimbabwean
Immigration
NonimmigrantsImmigrantsAfghanistanAfricaAlbaniaArgentinaArmeniaAsiaAustraliaAustriaBahamasBangladeshBarbadosBelarusBelgiumBelizeBoliviaBosnia and HerzegovinaBrazilBulgariaBurma/MyanmarCabo VerdeCambodiaCameroonCanadaCaribbeanCentral AmericaChileChinaColombiaCongoCosta RicaCroatiaCubaCzechoslovakiaDenmarkDominicaDominican RepublicEastern AfricaEastern AsiaEastern EuropeEcuadorEgyptEl SalvadorEnglandEritreaEthiopiaFijiFranceGermanyGhanaGreeceGrenadaGuatemalaGuyanaHaitiHondurasHong KongHungaryIndiaIndonesiaIranIraqIrelandIsraelItalyJamaicaJapanJordanKazakhstanKenyaKoreaKuwaitLaosLatin AmericaLatviaLebanonLiberiaLithuaniaMalaysiaMexicoMicronesiaMiddle AfricaMoldovaMoroccoNepalNetherlandsNicaraguaNigeriaNorth AmericaNorth MacedoniaNorthern AfricaNorthern EuropeNorwayOceaniaPakistanPanamaPeruPhilippinesPolandPortugalRomaniaRussiaSaudi ArabiaScotlandSenegalSerbiaSierra LeoneSingaporeSomaliaSouth AfricaSouth AmericaSouth Central AsiaSouth Eastern AsiaSouthern EuropeSpainSri LankaSt. Vincent and the GrenadinesSudanSwedenSwitzerlandSyriaTaiwanThailandTrinidad and TobagoTurkeyUgandaUkraineUruguayUzbekistanVenezuelaVietnamWest IndiesWestern AfricaWestern AsiaWestern EuropeYemenZaireZimbabweAzores
Immigrants from Europe
Race
Ancestry
AfghanAfricanAlaska NativeAlaskan AthabascanAlbanianAleutAlsatianAmericanApacheArabArapahoArgentineanArmenianAssyrian/Chaldean/SyriacAustralianAustrianBahamianBangladeshiBarbadianBasqueBelgianBelizeanBermudanBhutaneseBlackfeetBolivianBrazilianBritishBritish West IndianBulgarianBurmeseCajunCambodianCanadianCape VerdeanCarpatho RusynCelticCentral AmericanCentral American IndianCherokeeCheyenneChickasawChileanChineseChippewaChoctawColombianColvilleComancheCosta RicanCreeCreekCroatianCrowCubanCypriotCzechCzechoslovakianDanishDelawareDominicanDutchDutch West IndianEastern EuropeanEcuadorianEgyptianEnglishEthiopianEuropeanFijianFilipinoFinnishFrenchFrench American IndianFrench CanadianGermanGerman RussianGhanaianGreekGuamanian/ChamorroGuatemalanGuyaneseHaitianHmongHonduranHopiHoumaHungarianIcelanderIndian (Asian)IndonesianInupiatIranianIraqiIrishIroquoisIsraeliItalianJamaicanJapaneseJordanianKenyanKiowaKoreanLaotianLatvianLebaneseLiberianLithuanianLumbeeLuxembourgerMacedonianMalaysianMalteseMarshalleseMenomineeMexicanMexican American IndianMongolianMoroccanNative HawaiianNavajoNepaleseNew ZealanderNicaraguanNigerianNorthern EuropeanNorwegianOkinawanOsageOttawaPaiutePakistaniPalestinianPanamanianParaguayanPennsylvania GermanPeruvianPimaPolishPortuguesePotawatomiPuebloPuerto RicanPuget Sound SalishRomanianRussianSalvadoranSamoanScandinavianScotch-IrishScottishSeminoleSenegaleseSerbianShoshoneSierra LeoneanSiouxSlavicSlovakSloveneSomaliSouth AfricanSouth AmericanSouth American IndianSoviet UnionSpaniardSpanishSpanish AmericanSpanish American IndianSri LankanSubsaharan AfricanSudaneseSwedishSwissSyrianTaiwaneseThaiTlingit-HaidaTohono O'OdhamTonganTrinidadian and TobagonianTsimshianTurkishU.S. Virgin IslanderUgandanUkrainianUruguayanUteVenezuelanVietnameseWelshWest IndianYakamaYaquiYugoslavianYumanYup'ikZimbabwean
Immigration
NonimmigrantsImmigrantsAfghanistanAfricaAlbaniaArgentinaArmeniaAsiaAustraliaAustriaBahamasBangladeshBarbadosBelarusBelgiumBelizeBoliviaBosnia and HerzegovinaBrazilBulgariaBurma/MyanmarCabo VerdeCambodiaCameroonCanadaCaribbeanCentral AmericaChileChinaColombiaCongoCosta RicaCroatiaCubaCzechoslovakiaDenmarkDominicaDominican RepublicEastern AfricaEastern AsiaEastern EuropeEcuadorEgyptEl SalvadorEnglandEritreaEthiopiaEuropeFijiFranceGermanyGhanaGreeceGrenadaGuatemalaGuyanaHaitiHondurasHong KongHungaryIndiaIndonesiaIranIraqIrelandIsraelItalyJamaicaJapanJordanKazakhstanKenyaKoreaKuwaitLaosLatin AmericaLatviaLebanonLiberiaLithuaniaMalaysiaMexicoMicronesiaMiddle AfricaMoldovaMoroccoNepalNetherlandsNicaraguaNigeriaNorth AmericaNorth MacedoniaNorthern AfricaNorthern EuropeNorwayOceaniaPakistanPanamaPeruPhilippinesPolandPortugalRomaniaRussiaSaudi ArabiaScotlandSenegalSerbiaSierra LeoneSingaporeSomaliaSouth AfricaSouth AmericaSouth Central AsiaSouth Eastern AsiaSouthern EuropeSpainSri LankaSt. Vincent and the GrenadinesSudanSwedenSwitzerlandSyriaTaiwanThailandTrinidad and TobagoTurkeyUgandaUkraineUruguayUzbekistanVenezuelaVietnamWest IndiesWestern AfricaWestern AsiaWestern EuropeYemenZaireZimbabweAzores
Seniors Poverty Over the Age of 65
Income
Poverty
Unemployment
Labor Participation
Family Structure
Vehicle Availability
Education Level
Disability

Seniors Poverty Over the Age of 65 Comparison

Estonians

Immigrants from Europe

Exceptional
Excellent
9.6%
SENIORS POVERTY OVER THE AGE OF 65
99.5/ 100
METRIC RATING
45th/ 347
METRIC RANK
10.5%
SENIORS POVERTY OVER THE AGE OF 65
83.3/ 100
METRIC RATING
141st/ 347
METRIC RANK

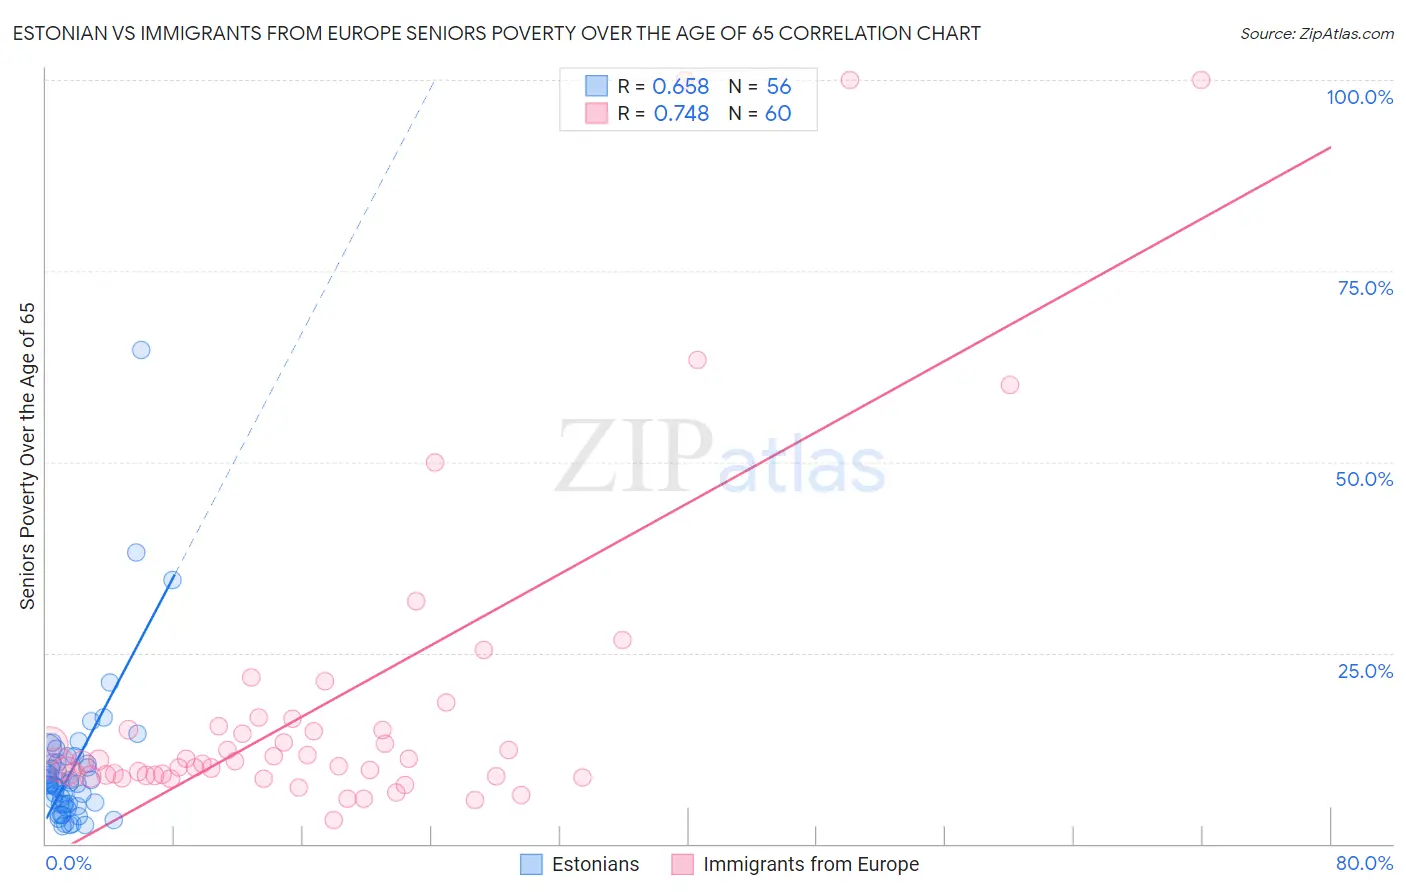
Estonian vs Immigrants from Europe Seniors Poverty Over the Age of 65 Correlation Chart

The statistical analysis conducted on geographies consisting of 123,369,266 people shows a significant positive correlation between the proportion of Estonians and poverty level among seniors over the age of 65 in the United States with a correlation coefficient (R) of 0.658 and weighted average of 9.6%. Similarly, the statistical analysis conducted on geographies consisting of 543,216,958 people shows a strong positive correlation between the proportion of Immigrants from Europe and poverty level among seniors over the age of 65 in the United States with a correlation coefficient (R) of 0.748 and weighted average of 10.5%, a difference of 9.3%.
Estonian vs Immigrants from Europe Seniors Poverty Over the Age of 65

Seniors Poverty Over the Age of 65 Correlation Summary

MeasurementEstonianImmigrants from Europe
Minimum2.2%3.2%
Maximum64.7%100.0%
Range62.5%96.8%
Mean9.9%18.5%
Median7.8%10.7%
Interquartile 25% (IQ1)5.2%8.9%
Interquartile 75% (IQ3)10.6%15.2%
Interquartile Range (IQR)5.4%6.2%
Standard Deviation (Sample)10.0%22.0%
Standard Deviation (Population)9.9%21.8%

Similar Demographics by Seniors Poverty Over the Age of 65

Demographics Similar to Estonians by Seniors Poverty Over the Age of 65

In terms of seniors poverty over the age of 65, the demographic groups most similar to Estonians are Immigrants from Taiwan (9.7%, a difference of 0.14%), Immigrants from South Central Asia (9.7%, a difference of 0.15%), Austrian (9.6%, a difference of 0.18%), French (9.7%, a difference of 0.25%), and Eastern European (9.6%, a difference of 0.28%).
DemographicsRating | RankSeniors Poverty Over the Age of 65
Belgians
99.7
/100
|
#38
Exceptional
9.5%
Greeks
99.6
/100
|
#39
Exceptional
9.6%
Assyrians/Chaldeans/Syriacs
99.6
/100
|
#40
Exceptional
9.6%
Immigrants | North Macedonia
99.6
/100
|
#41
Exceptional
9.6%
Zimbabweans
99.6
/100
|
#42
Exceptional
9.6%
Eastern Europeans
99.6
/100
|
#43
Exceptional
9.6%
Austrians
99.5
/100
|
#44
Exceptional
9.6%
Estonians
99.5
/100
|
#45
Exceptional
9.6%
Immigrants | Taiwan
99.5
/100
|
#46
Exceptional
9.7%
Immigrants | South Central Asia
99.5
/100
|
#47
Exceptional
9.7%
French
99.5
/100
|
#48
Exceptional
9.7%
Immigrants | Lithuania
99.4
/100
|
#49
Exceptional
9.7%
Hungarians
99.4
/100
|
#50
Exceptional
9.7%
Carpatho Rusyns
99.3
/100
|
#51
Exceptional
9.7%
Filipinos
99.3
/100
|
#52
Exceptional
9.7%

Demographics Similar to Immigrants from Europe by Seniors Poverty Over the Age of 65

In terms of seniors poverty over the age of 65, the demographic groups most similar to Immigrants from Europe are Immigrants from Kenya (10.5%, a difference of 0.020%), Osage (10.6%, a difference of 0.070%), Portuguese (10.5%, a difference of 0.15%), Immigrants from Latvia (10.5%, a difference of 0.25%), and Immigrants from Australia (10.5%, a difference of 0.31%).
DemographicsRating | RankSeniors Poverty Over the Age of 65
Sierra Leoneans
86.8
/100
|
#134
Excellent
10.5%
Immigrants | Norway
86.5
/100
|
#135
Excellent
10.5%
Immigrants | Serbia
86.4
/100
|
#136
Excellent
10.5%
Immigrants | Australia
85.1
/100
|
#137
Excellent
10.5%
Immigrants | Latvia
84.7
/100
|
#138
Excellent
10.5%
Portuguese
84.1
/100
|
#139
Excellent
10.5%
Immigrants | Kenya
83.4
/100
|
#140
Excellent
10.5%
Immigrants | Europe
83.3
/100
|
#141
Excellent
10.5%
Osage
82.8
/100
|
#142
Excellent
10.6%
Immigrants | Asia
80.8
/100
|
#143
Excellent
10.6%
Iraqis
80.7
/100
|
#144
Excellent
10.6%
Laotians
79.9
/100
|
#145
Good
10.6%
Alaskan Athabascans
79.1
/100
|
#146
Good
10.6%
Immigrants | Greece
79.0
/100
|
#147
Good
10.6%
Americans
78.1
/100
|
#148
Good
10.6%