Immigrants from Saudi Arabia vs Tongan Seniors Poverty Over the Age of 75
COMPARE
Immigrants from Saudi Arabia
Tongan
Seniors Poverty Over the Age of 75
Seniors Poverty Over the Age of 75 Comparison
Immigrants from Saudi Arabia
Tongans
12.2%
SENIORS POVERTY OVER THE AGE OF 75
49.5/ 100
METRIC RATING
175th/ 347
METRIC RANK
10.5%
SENIORS POVERTY OVER THE AGE OF 75
99.9/ 100
METRIC RATING
12th/ 347
METRIC RANK
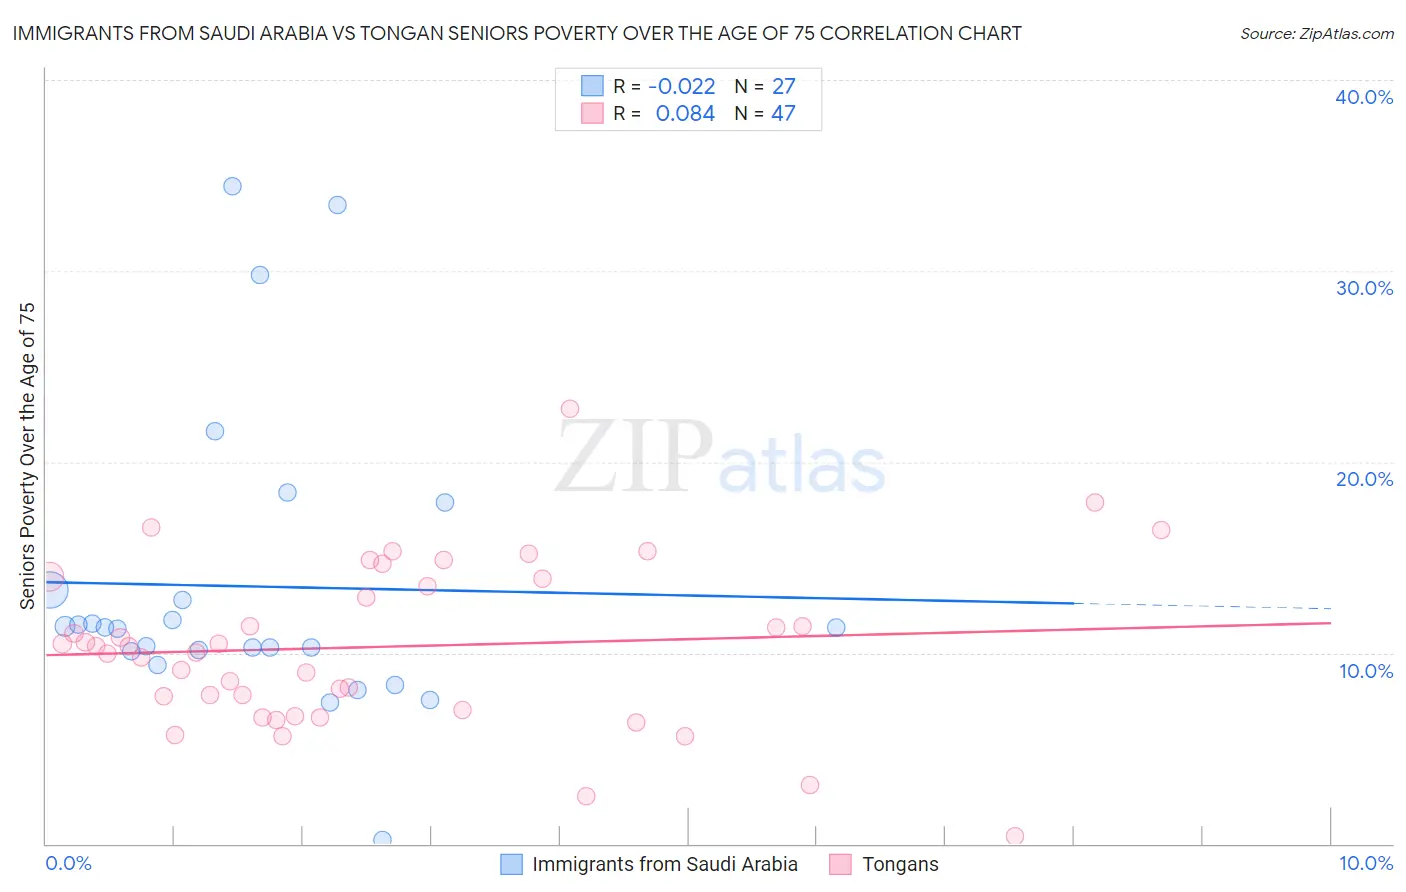
Immigrants from Saudi Arabia vs Tongan Seniors Poverty Over the Age of 75 Correlation Chart
The statistical analysis conducted on geographies consisting of 163,448,927 people shows no correlation between the proportion of Immigrants from Saudi Arabia and poverty level among seniors over the age of 75 in the United States with a correlation coefficient (R) of -0.022 and weighted average of 12.2%. Similarly, the statistical analysis conducted on geographies consisting of 102,339,025 people shows a slight positive correlation between the proportion of Tongans and poverty level among seniors over the age of 75 in the United States with a correlation coefficient (R) of 0.084 and weighted average of 10.5%, a difference of 16.3%.
Seniors Poverty Over the Age of 75 Correlation Summary
| Measurement | Immigrants from Saudi Arabia | Tongan |
| Minimum | 0.23% | 0.43% |
| Maximum | 34.4% | 22.8% |
| Range | 34.2% | 22.4% |
| Mean | 13.5% | 10.3% |
| Median | 11.3% | 10.3% |
| Interquartile 25% (IQ1) | 10.1% | 7.0% |
| Interquartile 75% (IQ3) | 13.3% | 13.9% |
| Interquartile Range (IQR) | 3.2% | 6.9% |
| Standard Deviation (Sample) | 7.9% | 4.3% |
| Standard Deviation (Population) | 7.8% | 4.3% |
Similar Demographics by Seniors Poverty Over the Age of 75
Demographics Similar to Immigrants from Saudi Arabia by Seniors Poverty Over the Age of 75
In terms of seniors poverty over the age of 75, the demographic groups most similar to Immigrants from Saudi Arabia are Immigrants from Europe (12.2%, a difference of 0.040%), Arab (12.2%, a difference of 0.080%), Immigrants from Iran (12.2%, a difference of 0.11%), Immigrants from Asia (12.2%, a difference of 0.13%), and Spaniard (12.2%, a difference of 0.17%).
| Demographics | Rating | Rank | Seniors Poverty Over the Age of 75 |
| Immigrants | Syria | 53.9 /100 | #168 | Average 12.2% |
| Immigrants | Egypt | 53.7 /100 | #169 | Average 12.2% |
| Immigrants | Thailand | 52.0 /100 | #170 | Average 12.2% |
| Spaniards | 51.6 /100 | #171 | Average 12.2% |
| Immigrants | Fiji | 51.5 /100 | #172 | Average 12.2% |
| Arabs | 50.5 /100 | #173 | Average 12.2% |
| Immigrants | Europe | 50.0 /100 | #174 | Average 12.2% |
| Immigrants | Saudi Arabia | 49.5 /100 | #175 | Average 12.2% |
| Immigrants | Iran | 48.1 /100 | #176 | Average 12.2% |
| Immigrants | Asia | 47.8 /100 | #177 | Average 12.2% |
| Immigrants | Nonimmigrants | 46.8 /100 | #178 | Average 12.2% |
| Mongolians | 45.5 /100 | #179 | Average 12.2% |
| Immigrants | South Eastern Asia | 44.3 /100 | #180 | Average 12.2% |
| Immigrants | Australia | 44.2 /100 | #181 | Average 12.2% |
| German Russians | 41.4 /100 | #182 | Average 12.3% |
Demographics Similar to Tongans by Seniors Poverty Over the Age of 75
In terms of seniors poverty over the age of 75, the demographic groups most similar to Tongans are Croatian (10.5%, a difference of 0.10%), Scottish (10.5%, a difference of 0.25%), European (10.5%, a difference of 0.25%), Immigrants from India (10.4%, a difference of 0.36%), and Dutch (10.5%, a difference of 0.37%).
| Demographics | Rating | Rank | Seniors Poverty Over the Age of 75 |
| Norwegians | 100.0 /100 | #5 | Exceptional 10.2% |
| Danes | 100.0 /100 | #6 | Exceptional 10.2% |
| Maltese | 100.0 /100 | #7 | Exceptional 10.3% |
| Germans | 99.9 /100 | #8 | Exceptional 10.4% |
| English | 99.9 /100 | #9 | Exceptional 10.4% |
| Scandinavians | 99.9 /100 | #10 | Exceptional 10.4% |
| Immigrants | India | 99.9 /100 | #11 | Exceptional 10.4% |
| Tongans | 99.9 /100 | #12 | Exceptional 10.5% |
| Croatians | 99.9 /100 | #13 | Exceptional 10.5% |
| Scottish | 99.9 /100 | #14 | Exceptional 10.5% |
| Europeans | 99.9 /100 | #15 | Exceptional 10.5% |
| Dutch | 99.9 /100 | #16 | Exceptional 10.5% |
| Slovaks | 99.9 /100 | #17 | Exceptional 10.5% |
| Welsh | 99.9 /100 | #18 | Exceptional 10.5% |
| Immigrants | Scotland | 99.9 /100 | #19 | Exceptional 10.5% |