Immigrants from India vs Tongan Seniors Poverty Over the Age of 75
COMPARE
Immigrants from India
Tongan
Seniors Poverty Over the Age of 75
Seniors Poverty Over the Age of 75 Comparison
Immigrants from India
Tongans
10.4%
SENIORS POVERTY OVER THE AGE OF 75
99.9/ 100
METRIC RATING
11th/ 347
METRIC RANK
10.5%
SENIORS POVERTY OVER THE AGE OF 75
99.9/ 100
METRIC RATING
12th/ 347
METRIC RANK
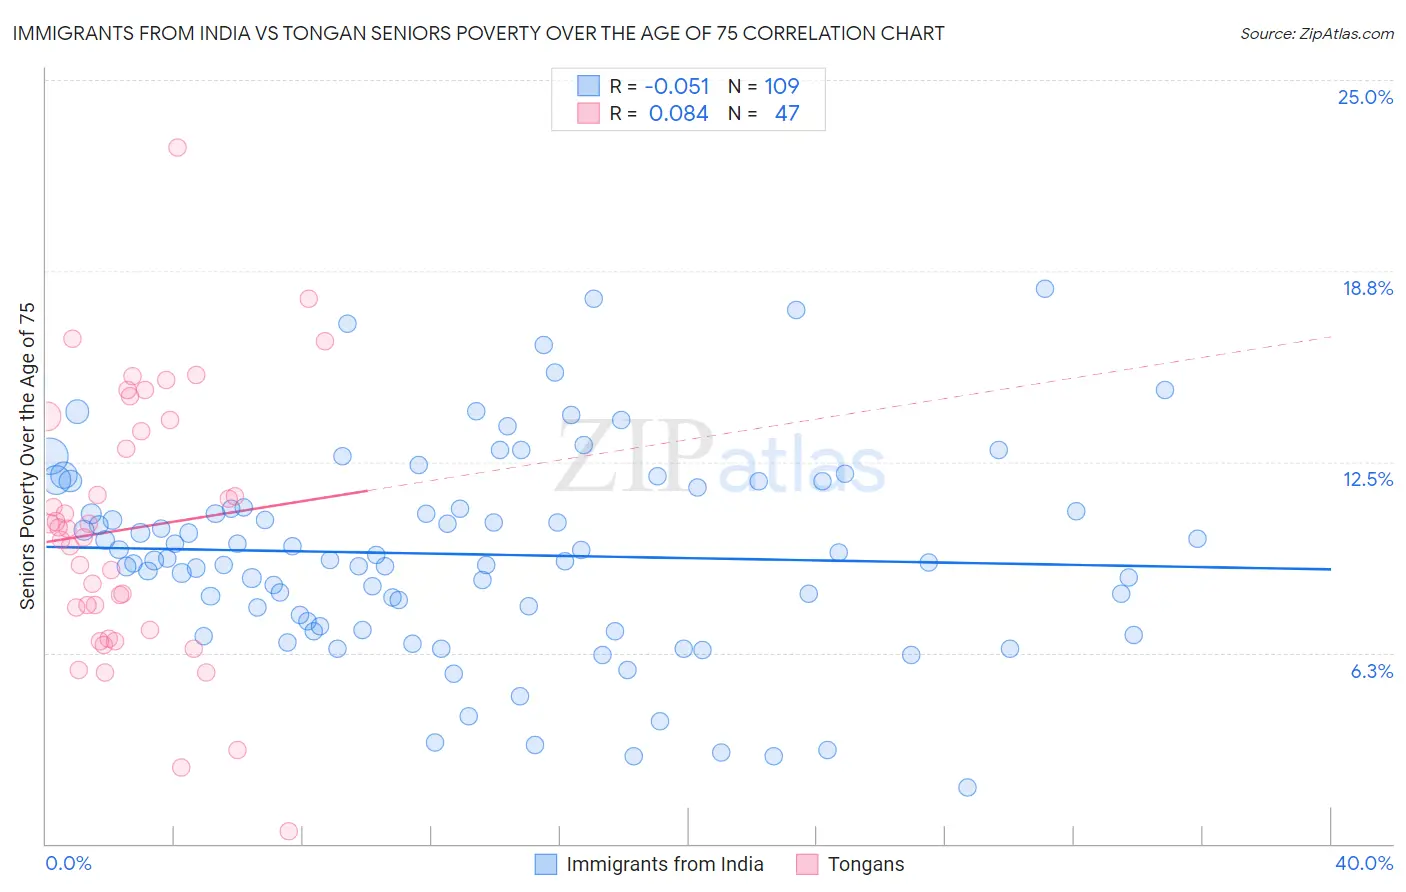
Immigrants from India vs Tongan Seniors Poverty Over the Age of 75 Correlation Chart
The statistical analysis conducted on geographies consisting of 428,032,626 people shows a slight negative correlation between the proportion of Immigrants from India and poverty level among seniors over the age of 75 in the United States with a correlation coefficient (R) of -0.051 and weighted average of 10.4%. Similarly, the statistical analysis conducted on geographies consisting of 102,339,025 people shows a slight positive correlation between the proportion of Tongans and poverty level among seniors over the age of 75 in the United States with a correlation coefficient (R) of 0.084 and weighted average of 10.5%, a difference of 0.36%.
Seniors Poverty Over the Age of 75 Correlation Summary
| Measurement | Immigrants from India | Tongan |
| Minimum | 1.8% | 0.43% |
| Maximum | 18.2% | 22.8% |
| Range | 16.4% | 22.4% |
| Mean | 9.5% | 10.3% |
| Median | 9.3% | 10.3% |
| Interquartile 25% (IQ1) | 7.2% | 7.0% |
| Interquartile 75% (IQ3) | 11.3% | 13.9% |
| Interquartile Range (IQR) | 4.1% | 6.9% |
| Standard Deviation (Sample) | 3.3% | 4.3% |
| Standard Deviation (Population) | 3.3% | 4.3% |
Demographics Similar to Immigrants from India and Tongans by Seniors Poverty Over the Age of 75
In terms of seniors poverty over the age of 75, the demographic groups most similar to Immigrants from India are Scandinavian (10.4%, a difference of 0.070%), Croatian (10.5%, a difference of 0.46%), English (10.4%, a difference of 0.56%), Scottish (10.5%, a difference of 0.61%), and European (10.5%, a difference of 0.62%). Similarly, the demographic groups most similar to Tongans are Croatian (10.5%, a difference of 0.10%), Scottish (10.5%, a difference of 0.25%), European (10.5%, a difference of 0.25%), Dutch (10.5%, a difference of 0.37%), and Scandinavian (10.4%, a difference of 0.43%).
| Demographics | Rating | Rank | Seniors Poverty Over the Age of 75 |
| Chinese | 100.0 /100 | #1 | Exceptional 9.1% |
| Tlingit-Haida | 100.0 /100 | #2 | Exceptional 9.7% |
| Native Hawaiians | 100.0 /100 | #3 | Exceptional 10.1% |
| Swedes | 100.0 /100 | #4 | Exceptional 10.2% |
| Norwegians | 100.0 /100 | #5 | Exceptional 10.2% |
| Danes | 100.0 /100 | #6 | Exceptional 10.2% |
| Maltese | 100.0 /100 | #7 | Exceptional 10.3% |
| Germans | 99.9 /100 | #8 | Exceptional 10.4% |
| English | 99.9 /100 | #9 | Exceptional 10.4% |
| Scandinavians | 99.9 /100 | #10 | Exceptional 10.4% |
| Immigrants | India | 99.9 /100 | #11 | Exceptional 10.4% |
| Tongans | 99.9 /100 | #12 | Exceptional 10.5% |
| Croatians | 99.9 /100 | #13 | Exceptional 10.5% |
| Scottish | 99.9 /100 | #14 | Exceptional 10.5% |
| Europeans | 99.9 /100 | #15 | Exceptional 10.5% |
| Dutch | 99.9 /100 | #16 | Exceptional 10.5% |
| Slovaks | 99.9 /100 | #17 | Exceptional 10.5% |
| Welsh | 99.9 /100 | #18 | Exceptional 10.5% |
| Immigrants | Scotland | 99.9 /100 | #19 | Exceptional 10.5% |
| Czechs | 99.9 /100 | #20 | Exceptional 10.5% |
| Slovenes | 99.9 /100 | #21 | Exceptional 10.6% |