Immigrants from Korea vs Tongan Seniors Poverty Over the Age of 75
COMPARE
Immigrants from Korea
Tongan
Seniors Poverty Over the Age of 75
Seniors Poverty Over the Age of 75 Comparison
Immigrants from Korea
Tongans
12.0%
SENIORS POVERTY OVER THE AGE OF 75
65.5/ 100
METRIC RATING
152nd/ 347
METRIC RANK
10.5%
SENIORS POVERTY OVER THE AGE OF 75
99.9/ 100
METRIC RATING
12th/ 347
METRIC RANK
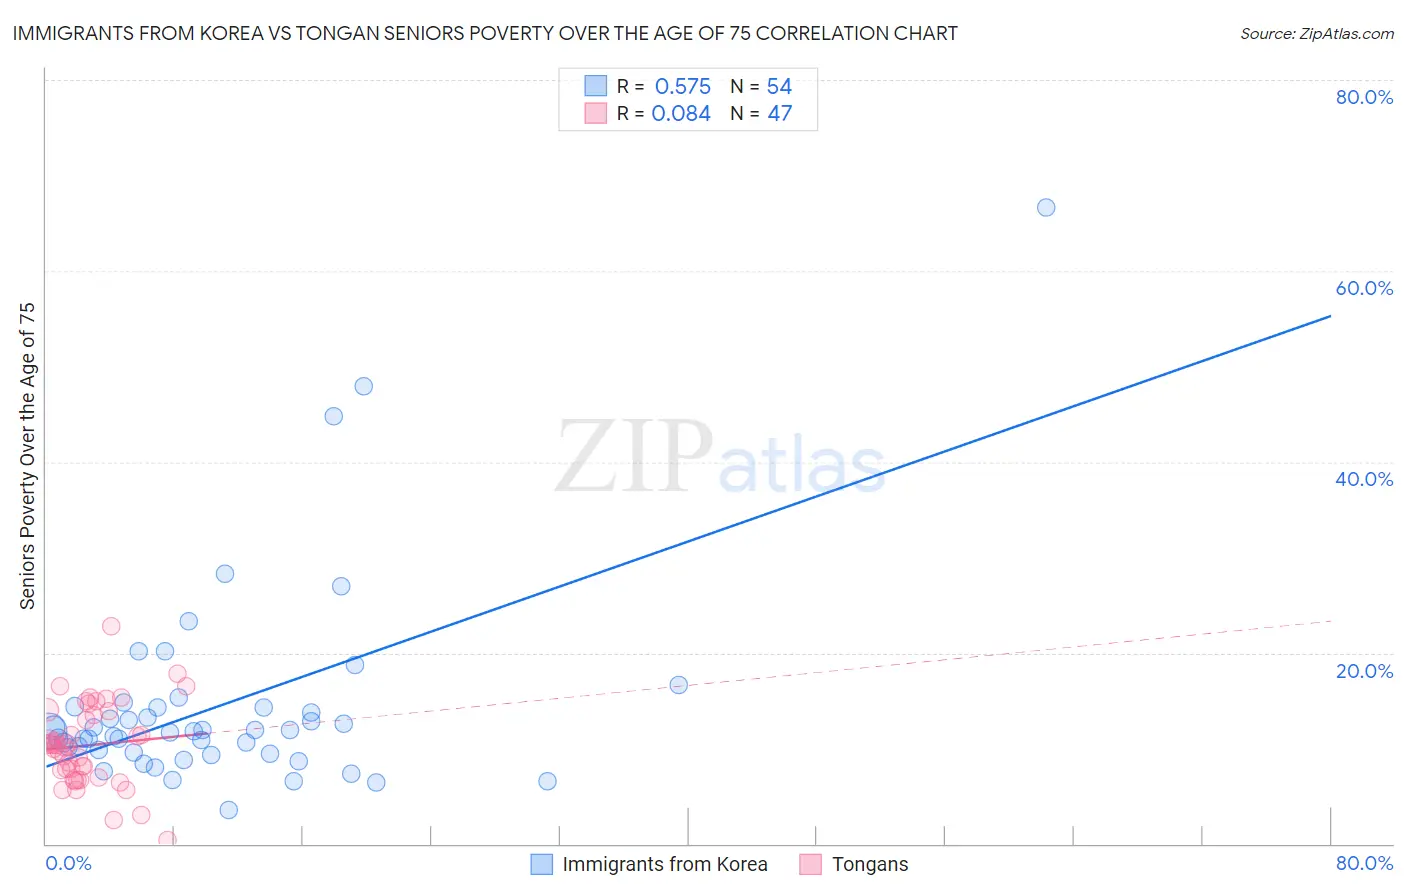
Immigrants from Korea vs Tongan Seniors Poverty Over the Age of 75 Correlation Chart
The statistical analysis conducted on geographies consisting of 410,560,504 people shows a substantial positive correlation between the proportion of Immigrants from Korea and poverty level among seniors over the age of 75 in the United States with a correlation coefficient (R) of 0.575 and weighted average of 12.0%. Similarly, the statistical analysis conducted on geographies consisting of 102,339,025 people shows a slight positive correlation between the proportion of Tongans and poverty level among seniors over the age of 75 in the United States with a correlation coefficient (R) of 0.084 and weighted average of 10.5%, a difference of 14.8%.
Seniors Poverty Over the Age of 75 Correlation Summary
| Measurement | Immigrants from Korea | Tongan |
| Minimum | 3.6% | 0.43% |
| Maximum | 66.7% | 22.8% |
| Range | 63.1% | 22.4% |
| Mean | 14.5% | 10.3% |
| Median | 11.8% | 10.3% |
| Interquartile 25% (IQ1) | 9.6% | 7.0% |
| Interquartile 75% (IQ3) | 14.3% | 13.9% |
| Interquartile Range (IQR) | 4.7% | 6.9% |
| Standard Deviation (Sample) | 10.8% | 4.3% |
| Standard Deviation (Population) | 10.7% | 4.3% |
Similar Demographics by Seniors Poverty Over the Age of 75
Demographics Similar to Immigrants from Korea by Seniors Poverty Over the Age of 75
In terms of seniors poverty over the age of 75, the demographic groups most similar to Immigrants from Korea are Cherokee (12.0%, a difference of 0.030%), Immigrants from Turkey (12.0%, a difference of 0.080%), Cambodian (12.0%, a difference of 0.14%), Cypriot (12.0%, a difference of 0.17%), and Asian (12.0%, a difference of 0.18%).
| Demographics | Rating | Rank | Seniors Poverty Over the Age of 75 |
| Immigrants | Belgium | 70.8 /100 | #145 | Good 12.0% |
| Bangladeshis | 70.4 /100 | #146 | Good 12.0% |
| Immigrants | Latvia | 69.1 /100 | #147 | Good 12.0% |
| Immigrants | Zaire | 67.6 /100 | #148 | Good 12.0% |
| Asians | 67.4 /100 | #149 | Good 12.0% |
| Cypriots | 67.3 /100 | #150 | Good 12.0% |
| Cherokee | 65.8 /100 | #151 | Good 12.0% |
| Immigrants | Korea | 65.5 /100 | #152 | Good 12.0% |
| Immigrants | Turkey | 64.7 /100 | #153 | Good 12.0% |
| Cambodians | 64.0 /100 | #154 | Good 12.0% |
| Indonesians | 62.6 /100 | #155 | Good 12.1% |
| Immigrants | Burma/Myanmar | 62.3 /100 | #156 | Good 12.1% |
| Immigrants | Sudan | 61.7 /100 | #157 | Good 12.1% |
| Portuguese | 61.3 /100 | #158 | Good 12.1% |
| Immigrants | Middle Africa | 61.2 /100 | #159 | Good 12.1% |
Demographics Similar to Tongans by Seniors Poverty Over the Age of 75
In terms of seniors poverty over the age of 75, the demographic groups most similar to Tongans are Croatian (10.5%, a difference of 0.10%), Scottish (10.5%, a difference of 0.25%), European (10.5%, a difference of 0.25%), Immigrants from India (10.4%, a difference of 0.36%), and Dutch (10.5%, a difference of 0.37%).
| Demographics | Rating | Rank | Seniors Poverty Over the Age of 75 |
| Norwegians | 100.0 /100 | #5 | Exceptional 10.2% |
| Danes | 100.0 /100 | #6 | Exceptional 10.2% |
| Maltese | 100.0 /100 | #7 | Exceptional 10.3% |
| Germans | 99.9 /100 | #8 | Exceptional 10.4% |
| English | 99.9 /100 | #9 | Exceptional 10.4% |
| Scandinavians | 99.9 /100 | #10 | Exceptional 10.4% |
| Immigrants | India | 99.9 /100 | #11 | Exceptional 10.4% |
| Tongans | 99.9 /100 | #12 | Exceptional 10.5% |
| Croatians | 99.9 /100 | #13 | Exceptional 10.5% |
| Scottish | 99.9 /100 | #14 | Exceptional 10.5% |
| Europeans | 99.9 /100 | #15 | Exceptional 10.5% |
| Dutch | 99.9 /100 | #16 | Exceptional 10.5% |
| Slovaks | 99.9 /100 | #17 | Exceptional 10.5% |
| Welsh | 99.9 /100 | #18 | Exceptional 10.5% |
| Immigrants | Scotland | 99.9 /100 | #19 | Exceptional 10.5% |