Immigrants from Russia vs Tsimshian Median Family Income
COMPARE
Immigrants from Russia
Tsimshian
Median Family Income
Median Family Income Comparison
Immigrants from Russia
Tsimshian
$116,942
MEDIAN FAMILY INCOME
99.9/ 100
METRIC RATING
46th/ 347
METRIC RANK
$101,543
MEDIAN FAMILY INCOME
35.9/ 100
METRIC RATING
182nd/ 347
METRIC RANK
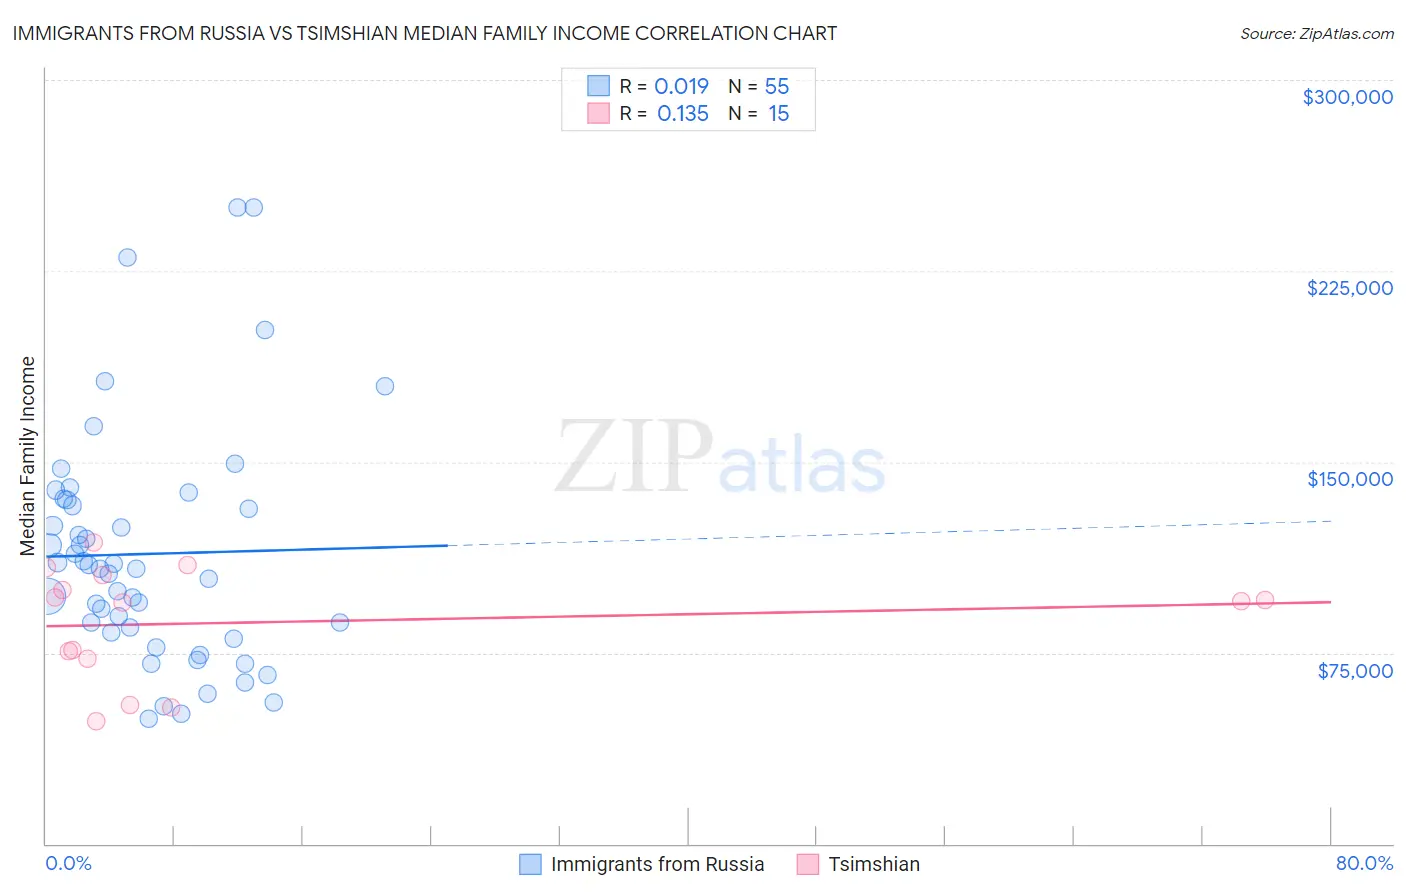
Immigrants from Russia vs Tsimshian Median Family Income Correlation Chart
The statistical analysis conducted on geographies consisting of 347,641,134 people shows no correlation between the proportion of Immigrants from Russia and median family income in the United States with a correlation coefficient (R) of 0.019 and weighted average of $116,942. Similarly, the statistical analysis conducted on geographies consisting of 15,626,544 people shows a poor positive correlation between the proportion of Tsimshian and median family income in the United States with a correlation coefficient (R) of 0.135 and weighted average of $101,543, a difference of 15.2%.
Median Family Income Correlation Summary
| Measurement | Immigrants from Russia | Tsimshian |
| Minimum | $49,167 | $47,917 |
| Maximum | $250,001 | $118,333 |
| Range | $200,834 | $70,416 |
| Mean | $113,842 | $86,976 |
| Median | $107,999 | $95,278 |
| Interquartile 25% (IQ1) | $83,101 | $72,646 |
| Interquartile 75% (IQ3) | $134,951 | $105,493 |
| Interquartile Range (IQR) | $51,850 | $32,847 |
| Standard Deviation (Sample) | $46,059 | $22,202 |
| Standard Deviation (Population) | $45,638 | $21,449 |
Similar Demographics by Median Family Income
Demographics Similar to Immigrants from Russia by Median Family Income
In terms of median family income, the demographic groups most similar to Immigrants from Russia are Immigrants from Austria ($116,830, a difference of 0.10%), Immigrants from Greece ($117,344, a difference of 0.34%), Immigrants from South Africa ($116,286, a difference of 0.56%), Chinese ($116,188, a difference of 0.65%), and Immigrants from Czechoslovakia ($116,165, a difference of 0.67%).
| Demographics | Rating | Rank | Median Family Income |
| Immigrants | Asia | 100.0 /100 | #39 | Exceptional $118,291 |
| Immigrants | Lithuania | 100.0 /100 | #40 | Exceptional $118,053 |
| Estonians | 100.0 /100 | #41 | Exceptional $118,013 |
| Immigrants | Bolivia | 100.0 /100 | #42 | Exceptional $117,912 |
| Bulgarians | 100.0 /100 | #43 | Exceptional $117,818 |
| Cambodians | 100.0 /100 | #44 | Exceptional $117,780 |
| Immigrants | Greece | 99.9 /100 | #45 | Exceptional $117,344 |
| Immigrants | Russia | 99.9 /100 | #46 | Exceptional $116,942 |
| Immigrants | Austria | 99.9 /100 | #47 | Exceptional $116,830 |
| Immigrants | South Africa | 99.9 /100 | #48 | Exceptional $116,286 |
| Chinese | 99.9 /100 | #49 | Exceptional $116,188 |
| Immigrants | Czechoslovakia | 99.9 /100 | #50 | Exceptional $116,165 |
| Immigrants | Malaysia | 99.9 /100 | #51 | Exceptional $115,880 |
| Maltese | 99.9 /100 | #52 | Exceptional $115,862 |
| Immigrants | Norway | 99.9 /100 | #53 | Exceptional $115,847 |
Demographics Similar to Tsimshian by Median Family Income
In terms of median family income, the demographic groups most similar to Tsimshian are Spaniard ($101,617, a difference of 0.070%), French Canadian ($101,634, a difference of 0.090%), Kenyan ($101,417, a difference of 0.12%), Immigrants from Costa Rica ($101,354, a difference of 0.19%), and South American ($101,856, a difference of 0.31%).
| Demographics | Rating | Rank | Median Family Income |
| Immigrants | Eastern Africa | 47.1 /100 | #175 | Average $102,451 |
| French | 46.1 /100 | #176 | Average $102,368 |
| Germans | 44.6 /100 | #177 | Average $102,254 |
| Welsh | 43.3 /100 | #178 | Average $102,151 |
| South Americans | 39.7 /100 | #179 | Fair $101,856 |
| French Canadians | 37.0 /100 | #180 | Fair $101,634 |
| Spaniards | 36.8 /100 | #181 | Fair $101,617 |
| Tsimshian | 35.9 /100 | #182 | Fair $101,543 |
| Kenyans | 34.5 /100 | #183 | Fair $101,417 |
| Immigrants | Costa Rica | 33.7 /100 | #184 | Fair $101,354 |
| Dutch | 31.9 /100 | #185 | Fair $101,192 |
| Celtics | 31.3 /100 | #186 | Fair $101,139 |
| Tlingit-Haida | 30.8 /100 | #187 | Fair $101,092 |
| Guamanians/Chamorros | 30.5 /100 | #188 | Fair $101,061 |
| Immigrants | Portugal | 29.6 /100 | #189 | Fair $100,984 |