Immigrants from Russia vs French American Indian Child Poverty Under the Age of 16
COMPARE
Immigrants from Russia
French American Indian
Child Poverty Under the Age of 16
Child Poverty Under the Age of 16 Comparison
Immigrants from Russia
French American Indians
14.5%
CHILD POVERTY UNDER THE AGE OF 16
97.3/ 100
METRIC RATING
78th/ 347
METRIC RANK
18.9%
CHILD POVERTY UNDER THE AGE OF 16
0.4/ 100
METRIC RATING
247th/ 347
METRIC RANK
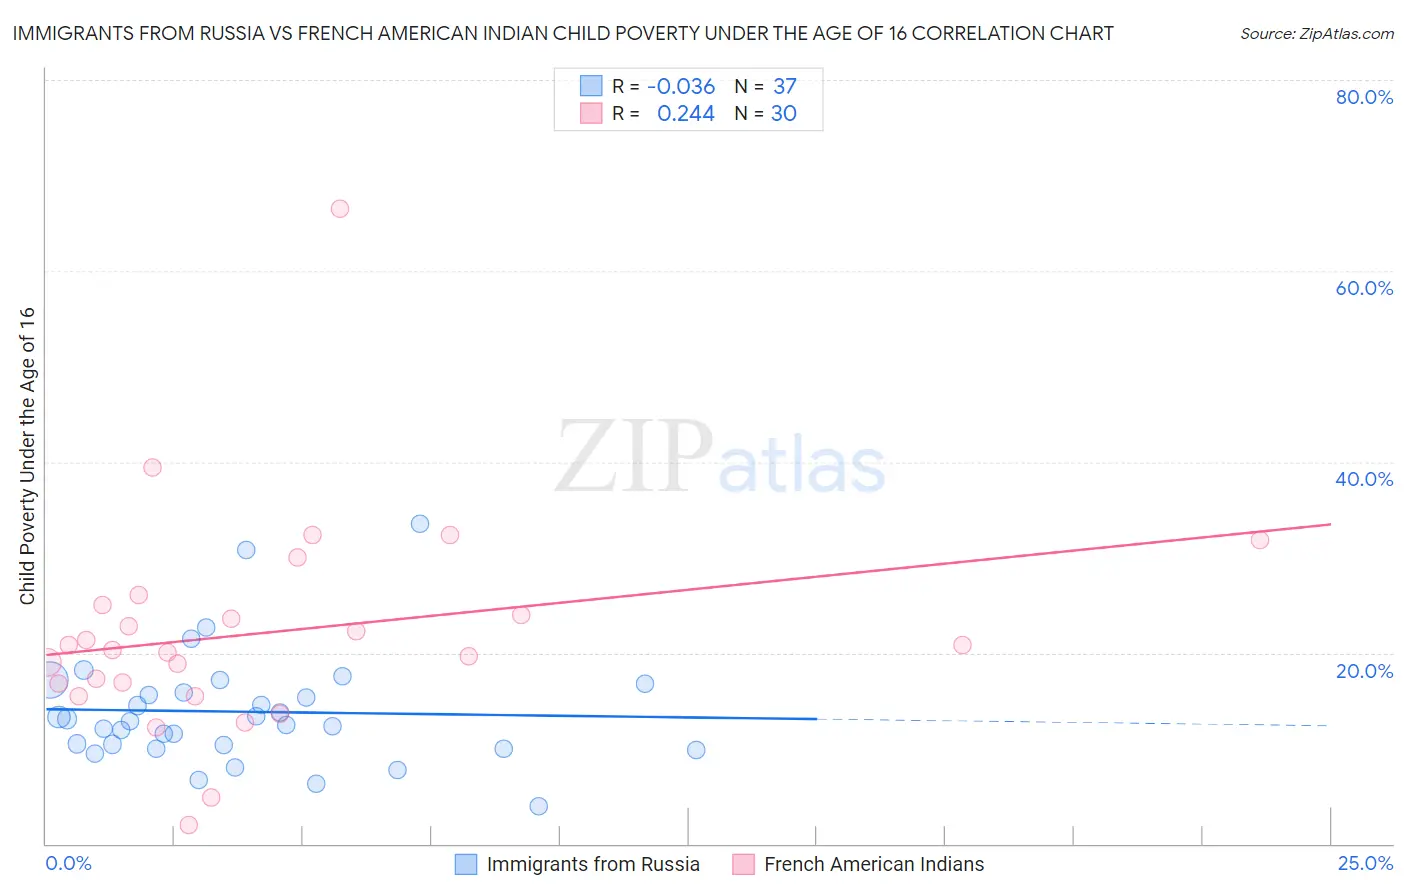
Immigrants from Russia vs French American Indian Child Poverty Under the Age of 16 Correlation Chart
The statistical analysis conducted on geographies consisting of 344,629,499 people shows no correlation between the proportion of Immigrants from Russia and poverty level among children under the age of 16 in the United States with a correlation coefficient (R) of -0.036 and weighted average of 14.5%. Similarly, the statistical analysis conducted on geographies consisting of 131,564,585 people shows a weak positive correlation between the proportion of French American Indians and poverty level among children under the age of 16 in the United States with a correlation coefficient (R) of 0.244 and weighted average of 18.9%, a difference of 30.5%.
Child Poverty Under the Age of 16 Correlation Summary
| Measurement | Immigrants from Russia | French American Indian |
| Minimum | 3.9% | 1.9% |
| Maximum | 33.5% | 66.5% |
| Range | 29.6% | 64.6% |
| Mean | 13.8% | 22.1% |
| Median | 12.8% | 20.6% |
| Interquartile 25% (IQ1) | 10.1% | 16.8% |
| Interquartile 75% (IQ3) | 16.3% | 25.0% |
| Interquartile Range (IQR) | 6.1% | 8.1% |
| Standard Deviation (Sample) | 6.0% | 11.5% |
| Standard Deviation (Population) | 5.9% | 11.3% |
Similar Demographics by Child Poverty Under the Age of 16
Demographics Similar to Immigrants from Russia by Child Poverty Under the Age of 16
In terms of child poverty under the age of 16, the demographic groups most similar to Immigrants from Russia are Swiss (14.5%, a difference of 0.020%), Immigrants from North Macedonia (14.5%, a difference of 0.10%), Finnish (14.5%, a difference of 0.12%), Immigrants from Canada (14.5%, a difference of 0.15%), and Australian (14.4%, a difference of 0.19%).
| Demographics | Rating | Rank | Child Poverty Under the Age of 16 |
| Immigrants | Poland | 97.9 /100 | #71 | Exceptional 14.3% |
| Cambodians | 97.8 /100 | #72 | Exceptional 14.4% |
| Immigrants | Turkey | 97.6 /100 | #73 | Exceptional 14.4% |
| Macedonians | 97.6 /100 | #74 | Exceptional 14.4% |
| Ukrainians | 97.5 /100 | #75 | Exceptional 14.4% |
| Immigrants | Eastern Europe | 97.5 /100 | #76 | Exceptional 14.4% |
| Australians | 97.5 /100 | #77 | Exceptional 14.4% |
| Immigrants | Russia | 97.3 /100 | #78 | Exceptional 14.5% |
| Swiss | 97.3 /100 | #79 | Exceptional 14.5% |
| Immigrants | North Macedonia | 97.2 /100 | #80 | Exceptional 14.5% |
| Finns | 97.2 /100 | #81 | Exceptional 14.5% |
| Immigrants | Canada | 97.2 /100 | #82 | Exceptional 14.5% |
| Egyptians | 97.2 /100 | #83 | Exceptional 14.5% |
| Immigrants | Latvia | 97.1 /100 | #84 | Exceptional 14.5% |
| Soviet Union | 97.1 /100 | #85 | Exceptional 14.5% |
Demographics Similar to French American Indians by Child Poverty Under the Age of 16
In terms of child poverty under the age of 16, the demographic groups most similar to French American Indians are Immigrants from Nicaragua (18.8%, a difference of 0.24%), Shoshone (18.8%, a difference of 0.27%), Ecuadorian (19.0%, a difference of 0.43%), Potawatomi (19.0%, a difference of 0.61%), and Immigrants from Middle Africa (19.0%, a difference of 0.81%).
| Demographics | Rating | Rank | Child Poverty Under the Age of 16 |
| Ghanaians | 0.8 /100 | #240 | Tragic 18.6% |
| Alsatians | 0.7 /100 | #241 | Tragic 18.6% |
| Immigrants | Laos | 0.6 /100 | #242 | Tragic 18.7% |
| Immigrants | Cuba | 0.6 /100 | #243 | Tragic 18.7% |
| Cape Verdeans | 0.6 /100 | #244 | Tragic 18.7% |
| Shoshone | 0.5 /100 | #245 | Tragic 18.8% |
| Immigrants | Nicaragua | 0.4 /100 | #246 | Tragic 18.8% |
| French American Indians | 0.4 /100 | #247 | Tragic 18.9% |
| Ecuadorians | 0.3 /100 | #248 | Tragic 19.0% |
| Potawatomi | 0.3 /100 | #249 | Tragic 19.0% |
| Immigrants | Middle Africa | 0.3 /100 | #250 | Tragic 19.0% |
| Immigrants | Ghana | 0.3 /100 | #251 | Tragic 19.1% |
| Immigrants | Trinidad and Tobago | 0.3 /100 | #252 | Tragic 19.1% |
| Salvadorans | 0.3 /100 | #253 | Tragic 19.1% |
| Immigrants | Western Africa | 0.2 /100 | #254 | Tragic 19.2% |