Seminole vs French American Indian Child Poverty Under the Age of 16
COMPARE
Seminole
French American Indian
Child Poverty Under the Age of 16
Child Poverty Under the Age of 16 Comparison
Seminole
French American Indians
21.1%
CHILD POVERTY UNDER THE AGE OF 16
0.0/ 100
METRIC RATING
305th/ 347
METRIC RANK
18.9%
CHILD POVERTY UNDER THE AGE OF 16
0.4/ 100
METRIC RATING
247th/ 347
METRIC RANK
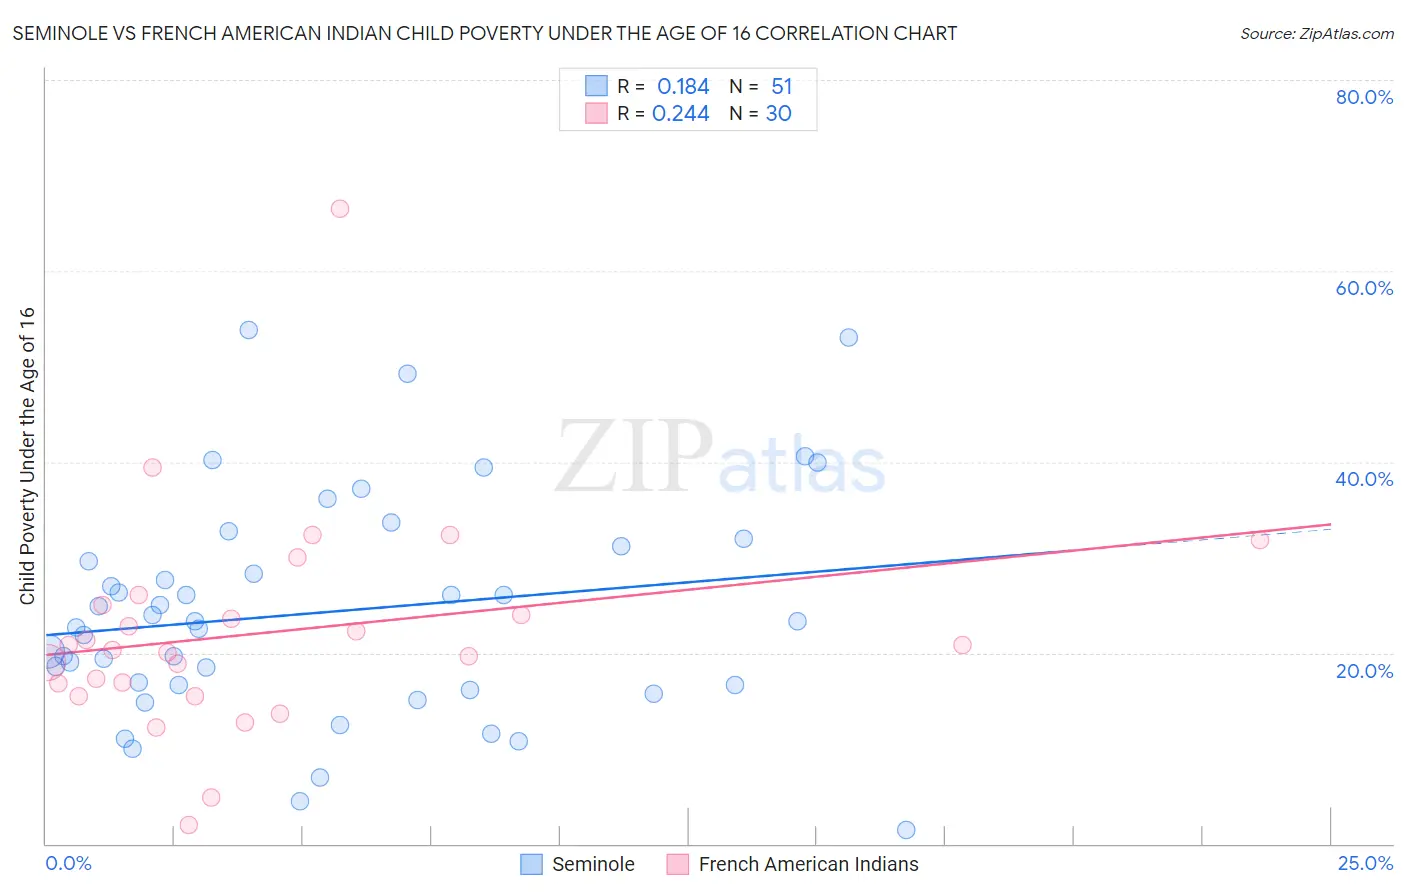
Seminole vs French American Indian Child Poverty Under the Age of 16 Correlation Chart
The statistical analysis conducted on geographies consisting of 118,162,960 people shows a poor positive correlation between the proportion of Seminole and poverty level among children under the age of 16 in the United States with a correlation coefficient (R) of 0.184 and weighted average of 21.1%. Similarly, the statistical analysis conducted on geographies consisting of 131,564,585 people shows a weak positive correlation between the proportion of French American Indians and poverty level among children under the age of 16 in the United States with a correlation coefficient (R) of 0.244 and weighted average of 18.9%, a difference of 12.0%.
Child Poverty Under the Age of 16 Correlation Summary
| Measurement | Seminole | French American Indian |
| Minimum | 1.5% | 1.9% |
| Maximum | 53.8% | 66.5% |
| Range | 52.4% | 64.6% |
| Mean | 24.3% | 22.1% |
| Median | 23.3% | 20.6% |
| Interquartile 25% (IQ1) | 16.7% | 16.8% |
| Interquartile 75% (IQ3) | 31.1% | 25.0% |
| Interquartile Range (IQR) | 14.5% | 8.1% |
| Standard Deviation (Sample) | 11.6% | 11.5% |
| Standard Deviation (Population) | 11.5% | 11.3% |
Similar Demographics by Child Poverty Under the Age of 16
Demographics Similar to Seminole by Child Poverty Under the Age of 16
In terms of child poverty under the age of 16, the demographic groups most similar to Seminole are Guatemalan (21.2%, a difference of 0.16%), Somali (21.0%, a difference of 0.47%), Choctaw (21.0%, a difference of 0.52%), Immigrants from Bahamas (21.0%, a difference of 0.56%), and Immigrants from Central America (21.3%, a difference of 0.57%).
| Demographics | Rating | Rank | Child Poverty Under the Age of 16 |
| Arapaho | 0.0 /100 | #298 | Tragic 20.8% |
| Immigrants | Haiti | 0.0 /100 | #299 | Tragic 20.9% |
| Indonesians | 0.0 /100 | #300 | Tragic 21.0% |
| Immigrants | Grenada | 0.0 /100 | #301 | Tragic 21.0% |
| Immigrants | Bahamas | 0.0 /100 | #302 | Tragic 21.0% |
| Choctaw | 0.0 /100 | #303 | Tragic 21.0% |
| Somalis | 0.0 /100 | #304 | Tragic 21.0% |
| Seminole | 0.0 /100 | #305 | Tragic 21.1% |
| Guatemalans | 0.0 /100 | #306 | Tragic 21.2% |
| Immigrants | Central America | 0.0 /100 | #307 | Tragic 21.3% |
| British West Indians | 0.0 /100 | #308 | Tragic 21.3% |
| Immigrants | Mexico | 0.0 /100 | #309 | Tragic 21.5% |
| Bahamians | 0.0 /100 | #310 | Tragic 21.5% |
| Dutch West Indians | 0.0 /100 | #311 | Tragic 21.5% |
| Ute | 0.0 /100 | #312 | Tragic 21.5% |
Demographics Similar to French American Indians by Child Poverty Under the Age of 16
In terms of child poverty under the age of 16, the demographic groups most similar to French American Indians are Immigrants from Nicaragua (18.8%, a difference of 0.24%), Shoshone (18.8%, a difference of 0.27%), Ecuadorian (19.0%, a difference of 0.43%), Potawatomi (19.0%, a difference of 0.61%), and Immigrants from Middle Africa (19.0%, a difference of 0.81%).
| Demographics | Rating | Rank | Child Poverty Under the Age of 16 |
| Ghanaians | 0.8 /100 | #240 | Tragic 18.6% |
| Alsatians | 0.7 /100 | #241 | Tragic 18.6% |
| Immigrants | Laos | 0.6 /100 | #242 | Tragic 18.7% |
| Immigrants | Cuba | 0.6 /100 | #243 | Tragic 18.7% |
| Cape Verdeans | 0.6 /100 | #244 | Tragic 18.7% |
| Shoshone | 0.5 /100 | #245 | Tragic 18.8% |
| Immigrants | Nicaragua | 0.4 /100 | #246 | Tragic 18.8% |
| French American Indians | 0.4 /100 | #247 | Tragic 18.9% |
| Ecuadorians | 0.3 /100 | #248 | Tragic 19.0% |
| Potawatomi | 0.3 /100 | #249 | Tragic 19.0% |
| Immigrants | Middle Africa | 0.3 /100 | #250 | Tragic 19.0% |
| Immigrants | Ghana | 0.3 /100 | #251 | Tragic 19.1% |
| Immigrants | Trinidad and Tobago | 0.3 /100 | #252 | Tragic 19.1% |
| Salvadorans | 0.3 /100 | #253 | Tragic 19.1% |
| Immigrants | Western Africa | 0.2 /100 | #254 | Tragic 19.2% |