Immigrants from Romania vs Czechoslovakian Receiving Food Stamps
COMPARE
Immigrants from Romania
Czechoslovakian
Receiving Food Stamps
Receiving Food Stamps Comparison
Immigrants from Romania
Czechoslovakians
10.0%
RECEIVING FOOD STAMPS
98.5/ 100
METRIC RATING
85th/ 347
METRIC RANK
10.3%
RECEIVING FOOD STAMPS
97.2/ 100
METRIC RATING
97th/ 347
METRIC RANK
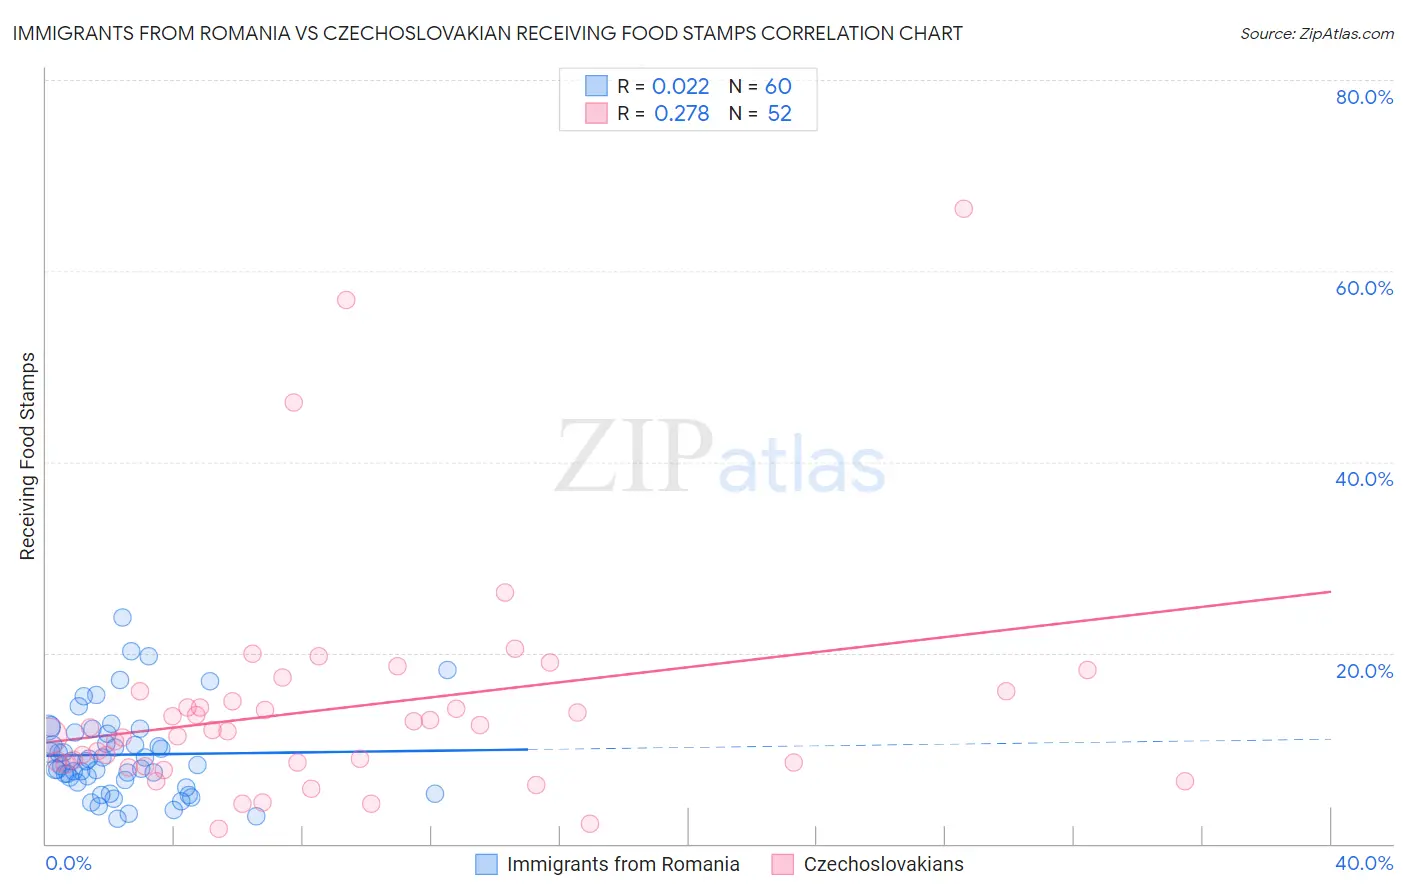
Immigrants from Romania vs Czechoslovakian Receiving Food Stamps Correlation Chart
The statistical analysis conducted on geographies consisting of 256,596,435 people shows no correlation between the proportion of Immigrants from Romania and percentage of population receiving government assistance and/or food stamps in the United States with a correlation coefficient (R) of 0.022 and weighted average of 10.0%. Similarly, the statistical analysis conducted on geographies consisting of 367,706,231 people shows a weak positive correlation between the proportion of Czechoslovakians and percentage of population receiving government assistance and/or food stamps in the United States with a correlation coefficient (R) of 0.278 and weighted average of 10.3%, a difference of 2.6%.
Receiving Food Stamps Correlation Summary
| Measurement | Immigrants from Romania | Czechoslovakian |
| Minimum | 2.6% | 1.6% |
| Maximum | 23.7% | 66.5% |
| Range | 21.1% | 64.9% |
| Mean | 9.3% | 14.2% |
| Median | 8.4% | 11.9% |
| Interquartile 25% (IQ1) | 6.6% | 8.4% |
| Interquartile 75% (IQ3) | 11.6% | 15.4% |
| Interquartile Range (IQR) | 5.1% | 7.0% |
| Standard Deviation (Sample) | 4.5% | 11.9% |
| Standard Deviation (Population) | 4.5% | 11.8% |
Demographics Similar to Immigrants from Romania and Czechoslovakians by Receiving Food Stamps
In terms of receiving food stamps, the demographic groups most similar to Immigrants from Romania are Immigrants from Norway (10.0%, a difference of 0.10%), Egyptian (10.0%, a difference of 0.13%), Immigrants from Israel (10.0%, a difference of 0.18%), Immigrants from Kuwait (10.0%, a difference of 0.19%), and Austrian (10.0%, a difference of 0.25%). Similarly, the demographic groups most similar to Czechoslovakians are Immigrants from Egypt (10.3%, a difference of 0.060%), Serbian (10.3%, a difference of 0.23%), Welsh (10.3%, a difference of 0.26%), Basque (10.3%, a difference of 0.31%), and Immigrants from Greece (10.3%, a difference of 0.34%).
| Demographics | Rating | Rank | Receiving Food Stamps |
| Immigrants | England | 98.6 /100 | #81 | Exceptional 10.0% |
| Austrians | 98.6 /100 | #82 | Exceptional 10.0% |
| Dutch | 98.6 /100 | #83 | Exceptional 10.0% |
| Immigrants | Israel | 98.5 /100 | #84 | Exceptional 10.0% |
| Immigrants | Romania | 98.5 /100 | #85 | Exceptional 10.0% |
| Immigrants | Norway | 98.4 /100 | #86 | Exceptional 10.0% |
| Egyptians | 98.4 /100 | #87 | Exceptional 10.0% |
| Immigrants | Kuwait | 98.4 /100 | #88 | Exceptional 10.0% |
| Immigrants | France | 98.3 /100 | #89 | Exceptional 10.1% |
| Finns | 97.9 /100 | #90 | Exceptional 10.2% |
| Jordanians | 97.9 /100 | #91 | Exceptional 10.2% |
| Irish | 97.9 /100 | #92 | Exceptional 10.2% |
| Belgians | 97.7 /100 | #93 | Exceptional 10.2% |
| Immigrants | Greece | 97.4 /100 | #94 | Exceptional 10.3% |
| Basques | 97.4 /100 | #95 | Exceptional 10.3% |
| Welsh | 97.3 /100 | #96 | Exceptional 10.3% |
| Czechoslovakians | 97.2 /100 | #97 | Exceptional 10.3% |
| Immigrants | Egypt | 97.1 /100 | #98 | Exceptional 10.3% |
| Serbians | 97.0 /100 | #99 | Exceptional 10.3% |
| Immigrants | Western Europe | 96.9 /100 | #100 | Exceptional 10.3% |
| Palestinians | 96.9 /100 | #101 | Exceptional 10.3% |