British vs Czechoslovakian Receiving Food Stamps
COMPARE
British
Czechoslovakian
Receiving Food Stamps
Receiving Food Stamps Comparison
British
Czechoslovakians
9.7%
RECEIVING FOOD STAMPS
99.2/ 100
METRIC RATING
59th/ 347
METRIC RANK
10.3%
RECEIVING FOOD STAMPS
97.2/ 100
METRIC RATING
97th/ 347
METRIC RANK
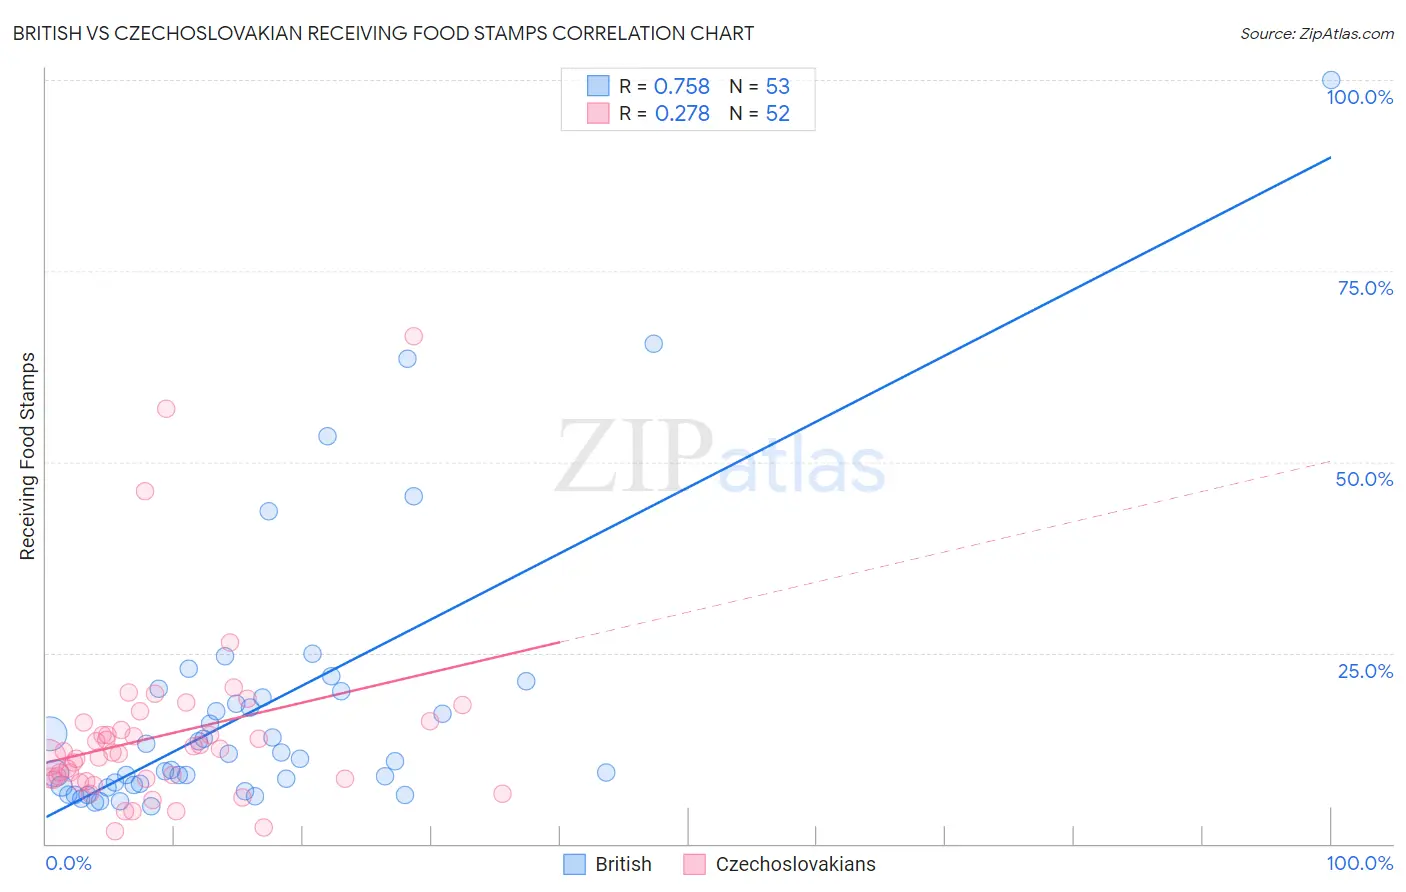
British vs Czechoslovakian Receiving Food Stamps Correlation Chart
The statistical analysis conducted on geographies consisting of 528,917,419 people shows a strong positive correlation between the proportion of British and percentage of population receiving government assistance and/or food stamps in the United States with a correlation coefficient (R) of 0.758 and weighted average of 9.7%. Similarly, the statistical analysis conducted on geographies consisting of 367,706,231 people shows a weak positive correlation between the proportion of Czechoslovakians and percentage of population receiving government assistance and/or food stamps in the United States with a correlation coefficient (R) of 0.278 and weighted average of 10.3%, a difference of 5.7%.
Receiving Food Stamps Correlation Summary
| Measurement | British | Czechoslovakian |
| Minimum | 4.9% | 1.6% |
| Maximum | 100.0% | 66.5% |
| Range | 95.1% | 64.9% |
| Mean | 17.6% | 14.2% |
| Median | 11.1% | 11.9% |
| Interquartile 25% (IQ1) | 7.6% | 8.4% |
| Interquartile 75% (IQ3) | 19.6% | 15.4% |
| Interquartile Range (IQR) | 12.0% | 7.0% |
| Standard Deviation (Sample) | 18.1% | 11.9% |
| Standard Deviation (Population) | 17.9% | 11.8% |
Similar Demographics by Receiving Food Stamps
Demographics Similar to British by Receiving Food Stamps
In terms of receiving food stamps, the demographic groups most similar to British are Scandinavian (9.7%, a difference of 0.030%), Greek (9.7%, a difference of 0.090%), German (9.7%, a difference of 0.10%), Immigrants from Canada (9.7%, a difference of 0.20%), and English (9.8%, a difference of 0.24%).
| Demographics | Rating | Rank | Receiving Food Stamps |
| Immigrants | South Africa | 99.3 /100 | #52 | Exceptional 9.7% |
| Tongans | 99.3 /100 | #53 | Exceptional 9.7% |
| Swiss | 99.3 /100 | #54 | Exceptional 9.7% |
| Immigrants | Switzerland | 99.3 /100 | #55 | Exceptional 9.7% |
| Immigrants | Canada | 99.3 /100 | #56 | Exceptional 9.7% |
| Greeks | 99.3 /100 | #57 | Exceptional 9.7% |
| Scandinavians | 99.2 /100 | #58 | Exceptional 9.7% |
| British | 99.2 /100 | #59 | Exceptional 9.7% |
| Germans | 99.2 /100 | #60 | Exceptional 9.7% |
| English | 99.2 /100 | #61 | Exceptional 9.8% |
| Immigrants | Bulgaria | 99.2 /100 | #62 | Exceptional 9.8% |
| Chinese | 99.2 /100 | #63 | Exceptional 9.8% |
| Immigrants | North America | 99.2 /100 | #64 | Exceptional 9.8% |
| Immigrants | Turkey | 99.1 /100 | #65 | Exceptional 9.8% |
| Slovenes | 99.1 /100 | #66 | Exceptional 9.8% |
Demographics Similar to Czechoslovakians by Receiving Food Stamps
In terms of receiving food stamps, the demographic groups most similar to Czechoslovakians are Immigrants from Egypt (10.3%, a difference of 0.060%), Serbian (10.3%, a difference of 0.23%), Welsh (10.3%, a difference of 0.26%), Basque (10.3%, a difference of 0.31%), and Immigrants from Greece (10.3%, a difference of 0.34%).
| Demographics | Rating | Rank | Receiving Food Stamps |
| Finns | 97.9 /100 | #90 | Exceptional 10.2% |
| Jordanians | 97.9 /100 | #91 | Exceptional 10.2% |
| Irish | 97.9 /100 | #92 | Exceptional 10.2% |
| Belgians | 97.7 /100 | #93 | Exceptional 10.2% |
| Immigrants | Greece | 97.4 /100 | #94 | Exceptional 10.3% |
| Basques | 97.4 /100 | #95 | Exceptional 10.3% |
| Welsh | 97.3 /100 | #96 | Exceptional 10.3% |
| Czechoslovakians | 97.2 /100 | #97 | Exceptional 10.3% |
| Immigrants | Egypt | 97.1 /100 | #98 | Exceptional 10.3% |
| Serbians | 97.0 /100 | #99 | Exceptional 10.3% |
| Immigrants | Western Europe | 96.9 /100 | #100 | Exceptional 10.3% |
| Palestinians | 96.9 /100 | #101 | Exceptional 10.3% |
| Immigrants | Europe | 96.8 /100 | #102 | Exceptional 10.3% |
| Immigrants | Latvia | 96.8 /100 | #103 | Exceptional 10.3% |
| Immigrants | Hungary | 96.7 /100 | #104 | Exceptional 10.3% |