Immigrants from Romania vs Colville 1st Grade
COMPARE
Immigrants from Romania
Colville
1st Grade
1st Grade Comparison
Immigrants from Romania
Colville
98.1%
1ST GRADE
87.8/ 100
METRIC RATING
138th/ 347
METRIC RANK
98.2%
1ST GRADE
98.0/ 100
METRIC RATING
100th/ 347
METRIC RANK
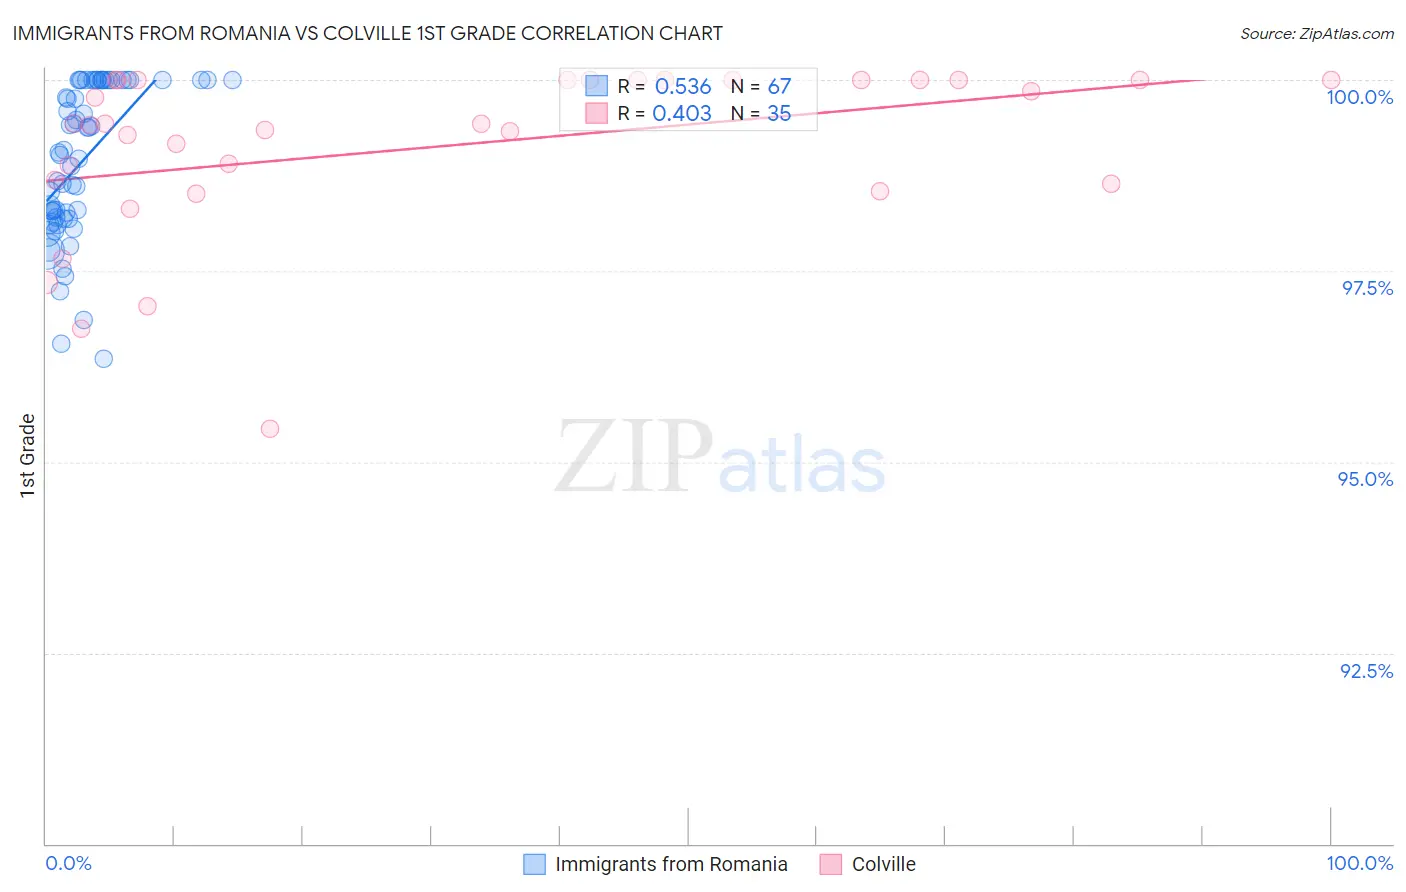
Immigrants from Romania vs Colville 1st Grade Correlation Chart
The statistical analysis conducted on geographies consisting of 257,006,599 people shows a substantial positive correlation between the proportion of Immigrants from Romania and percentage of population with at least 1st grade education in the United States with a correlation coefficient (R) of 0.536 and weighted average of 98.1%. Similarly, the statistical analysis conducted on geographies consisting of 34,687,839 people shows a moderate positive correlation between the proportion of Colville and percentage of population with at least 1st grade education in the United States with a correlation coefficient (R) of 0.403 and weighted average of 98.2%, a difference of 0.15%.
1st Grade Correlation Summary
| Measurement | Immigrants from Romania | Colville |
| Minimum | 96.4% | 95.4% |
| Maximum | 100.0% | 100.0% |
| Range | 3.6% | 4.6% |
| Mean | 98.9% | 99.1% |
| Median | 99.1% | 99.4% |
| Interquartile 25% (IQ1) | 98.2% | 98.6% |
| Interquartile 75% (IQ3) | 100.0% | 100.0% |
| Interquartile Range (IQR) | 1.8% | 1.4% |
| Standard Deviation (Sample) | 1.00% | 1.1% |
| Standard Deviation (Population) | 0.99% | 1.1% |
Similar Demographics by 1st Grade
Demographics Similar to Immigrants from Romania by 1st Grade
In terms of 1st grade, the demographic groups most similar to Immigrants from Romania are Israeli (98.1%, a difference of 0.0%), Blackfeet (98.1%, a difference of 0.0%), Immigrants from Hungary (98.1%, a difference of 0.010%), Immigrants from Kuwait (98.1%, a difference of 0.010%), and Immigrants from Bulgaria (98.1%, a difference of 0.010%).
| Demographics | Rating | Rank | 1st Grade |
| Spaniards | 91.2 /100 | #131 | Exceptional 98.1% |
| Cambodians | 90.9 /100 | #132 | Exceptional 98.1% |
| Immigrants | Europe | 90.5 /100 | #133 | Exceptional 98.1% |
| Immigrants | Hungary | 89.4 /100 | #134 | Excellent 98.1% |
| Immigrants | Kuwait | 89.3 /100 | #135 | Excellent 98.1% |
| Immigrants | Bulgaria | 88.8 /100 | #136 | Excellent 98.1% |
| Israelis | 87.8 /100 | #137 | Excellent 98.1% |
| Immigrants | Romania | 87.8 /100 | #138 | Excellent 98.1% |
| Blackfeet | 87.6 /100 | #139 | Excellent 98.1% |
| Palestinians | 83.0 /100 | #140 | Excellent 98.0% |
| Immigrants | Turkey | 82.8 /100 | #141 | Excellent 98.0% |
| Marshallese | 82.0 /100 | #142 | Excellent 98.0% |
| Burmese | 81.0 /100 | #143 | Excellent 98.0% |
| Alsatians | 80.9 /100 | #144 | Excellent 98.0% |
| Hmong | 79.0 /100 | #145 | Good 98.0% |
Demographics Similar to Colville by 1st Grade
In terms of 1st grade, the demographic groups most similar to Colville are Cypriot (98.2%, a difference of 0.010%), Nonimmigrants (98.2%, a difference of 0.010%), Choctaw (98.2%, a difference of 0.010%), Puget Sound Salish (98.2%, a difference of 0.010%), and Romanian (98.2%, a difference of 0.010%).
| Demographics | Rating | Rank | 1st Grade |
| Immigrants | India | 98.6 /100 | #93 | Exceptional 98.2% |
| South Africans | 98.6 /100 | #94 | Exceptional 98.2% |
| Immigrants | Germany | 98.5 /100 | #95 | Exceptional 98.2% |
| Cypriots | 98.3 /100 | #96 | Exceptional 98.2% |
| Immigrants | Nonimmigrants | 98.3 /100 | #97 | Exceptional 98.2% |
| Choctaw | 98.3 /100 | #98 | Exceptional 98.2% |
| Puget Sound Salish | 98.2 /100 | #99 | Exceptional 98.2% |
| Colville | 98.0 /100 | #100 | Exceptional 98.2% |
| Romanians | 97.8 /100 | #101 | Exceptional 98.2% |
| Cree | 97.8 /100 | #102 | Exceptional 98.2% |
| Immigrants | Ireland | 97.7 /100 | #103 | Exceptional 98.2% |
| Pima | 97.5 /100 | #104 | Exceptional 98.2% |
| Basques | 97.4 /100 | #105 | Exceptional 98.2% |
| Turks | 97.4 /100 | #106 | Exceptional 98.2% |
| Immigrants | Switzerland | 97.3 /100 | #107 | Exceptional 98.2% |