Immigrants from Portugal vs Immigrants from Western Asia Child Poverty Under the Age of 16
COMPARE
Immigrants from Portugal
Immigrants from Western Asia
Child Poverty Under the Age of 16
Child Poverty Under the Age of 16 Comparison
Immigrants from Portugal
Immigrants from Western Asia
16.6%
CHILD POVERTY UNDER THE AGE OF 16
30.0/ 100
METRIC RATING
189th/ 347
METRIC RANK
16.4%
CHILD POVERTY UNDER THE AGE OF 16
38.0/ 100
METRIC RATING
184th/ 347
METRIC RANK
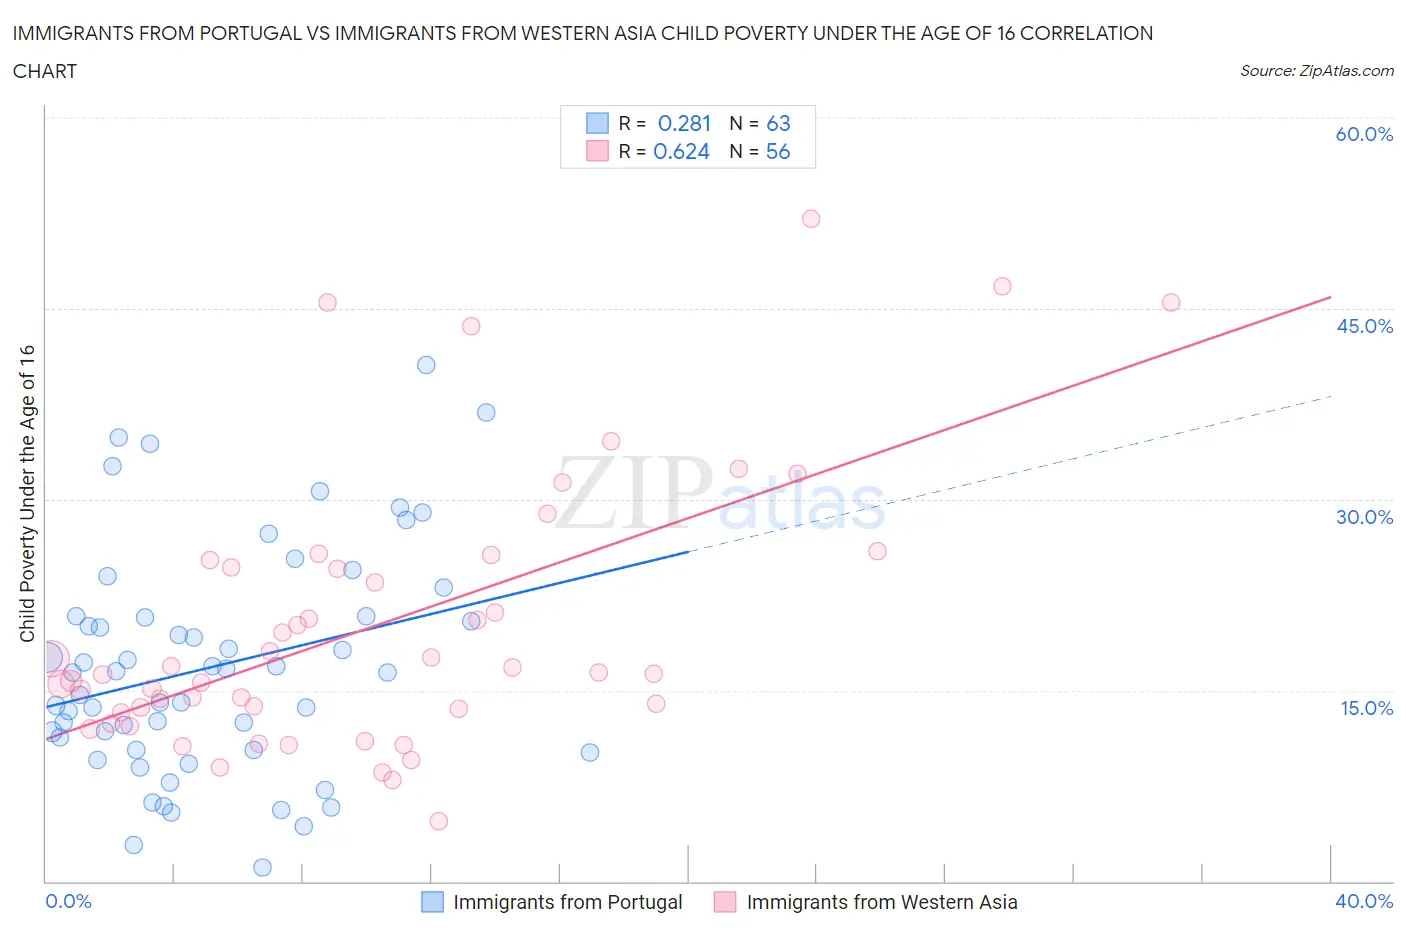
Immigrants from Portugal vs Immigrants from Western Asia Child Poverty Under the Age of 16 Correlation Chart
The statistical analysis conducted on geographies consisting of 173,575,253 people shows a weak positive correlation between the proportion of Immigrants from Portugal and poverty level among children under the age of 16 in the United States with a correlation coefficient (R) of 0.281 and weighted average of 16.6%. Similarly, the statistical analysis conducted on geographies consisting of 400,247,693 people shows a significant positive correlation between the proportion of Immigrants from Western Asia and poverty level among children under the age of 16 in the United States with a correlation coefficient (R) of 0.624 and weighted average of 16.4%, a difference of 1.1%.
Child Poverty Under the Age of 16 Correlation Summary
| Measurement | Immigrants from Portugal | Immigrants from Western Asia |
| Minimum | 1.1% | 4.7% |
| Maximum | 40.5% | 52.0% |
| Range | 39.4% | 47.3% |
| Mean | 16.9% | 20.1% |
| Median | 16.4% | 16.3% |
| Interquartile 25% (IQ1) | 10.3% | 13.4% |
| Interquartile 75% (IQ3) | 20.8% | 25.0% |
| Interquartile Range (IQR) | 10.5% | 11.6% |
| Standard Deviation (Sample) | 8.8% | 10.7% |
| Standard Deviation (Population) | 8.7% | 10.6% |
Demographics Similar to Immigrants from Portugal and Immigrants from Western Asia by Child Poverty Under the Age of 16
In terms of child poverty under the age of 16, the demographic groups most similar to Immigrants from Portugal are Immigrants from Costa Rica (16.6%, a difference of 0.060%), Immigrants from Morocco (16.6%, a difference of 0.17%), Arab (16.6%, a difference of 0.19%), Immigrants from Iraq (16.7%, a difference of 0.25%), and Kenyan (16.5%, a difference of 0.55%). Similarly, the demographic groups most similar to Immigrants from Western Asia are Celtic (16.4%, a difference of 0.020%), Hawaiian (16.4%, a difference of 0.030%), Immigrants from Bosnia and Herzegovina (16.5%, a difference of 0.080%), Immigrants from South America (16.4%, a difference of 0.36%), and South American Indian (16.4%, a difference of 0.48%).
| Demographics | Rating | Rank | Child Poverty Under the Age of 16 |
| Lebanese | 45.9 /100 | #176 | Average 16.3% |
| Ethiopians | 43.4 /100 | #177 | Average 16.3% |
| Immigrants | Ethiopia | 42.3 /100 | #178 | Average 16.4% |
| Immigrants | Syria | 42.3 /100 | #179 | Average 16.4% |
| South American Indians | 41.8 /100 | #180 | Average 16.4% |
| Immigrants | South America | 40.8 /100 | #181 | Average 16.4% |
| Hawaiians | 38.2 /100 | #182 | Fair 16.4% |
| Celtics | 38.2 /100 | #183 | Fair 16.4% |
| Immigrants | Western Asia | 38.0 /100 | #184 | Fair 16.4% |
| Immigrants | Bosnia and Herzegovina | 37.4 /100 | #185 | Fair 16.5% |
| Kenyans | 34.1 /100 | #186 | Fair 16.5% |
| Arabs | 31.4 /100 | #187 | Fair 16.6% |
| Immigrants | Morocco | 31.2 /100 | #188 | Fair 16.6% |
| Immigrants | Portugal | 30.0 /100 | #189 | Fair 16.6% |
| Immigrants | Costa Rica | 29.6 /100 | #190 | Fair 16.6% |
| Immigrants | Iraq | 28.3 /100 | #191 | Fair 16.7% |
| Spanish | 24.5 /100 | #192 | Fair 16.7% |
| Spaniards | 23.2 /100 | #193 | Fair 16.8% |
| Immigrants | Uruguay | 23.1 /100 | #194 | Fair 16.8% |
| Immigrants | Uganda | 22.5 /100 | #195 | Fair 16.8% |
| Immigrants | Lebanon | 22.0 /100 | #196 | Fair 16.8% |