Immigrants from Portugal vs Panamanian Child Poverty Under the Age of 16
COMPARE
Immigrants from Portugal
Panamanian
Child Poverty Under the Age of 16
Child Poverty Under the Age of 16 Comparison
Immigrants from Portugal
Panamanians
16.6%
CHILD POVERTY UNDER THE AGE OF 16
30.0/ 100
METRIC RATING
189th/ 347
METRIC RANK
17.5%
CHILD POVERTY UNDER THE AGE OF 16
6.9/ 100
METRIC RATING
209th/ 347
METRIC RANK
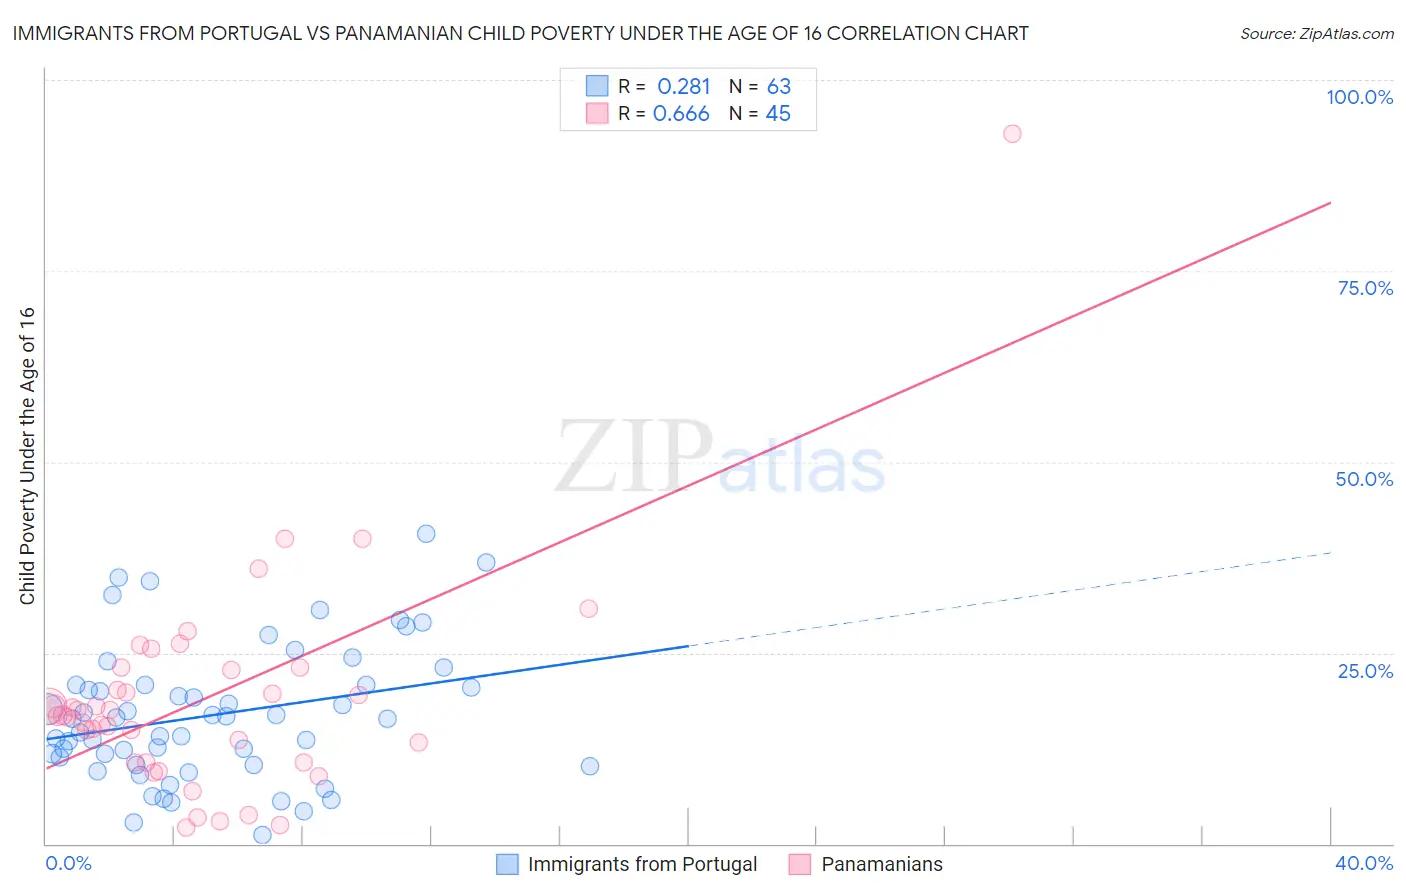
Immigrants from Portugal vs Panamanian Child Poverty Under the Age of 16 Correlation Chart
The statistical analysis conducted on geographies consisting of 173,575,253 people shows a weak positive correlation between the proportion of Immigrants from Portugal and poverty level among children under the age of 16 in the United States with a correlation coefficient (R) of 0.281 and weighted average of 16.6%. Similarly, the statistical analysis conducted on geographies consisting of 280,029,681 people shows a significant positive correlation between the proportion of Panamanians and poverty level among children under the age of 16 in the United States with a correlation coefficient (R) of 0.666 and weighted average of 17.5%, a difference of 5.1%.
Child Poverty Under the Age of 16 Correlation Summary
| Measurement | Immigrants from Portugal | Panamanian |
| Minimum | 1.1% | 2.1% |
| Maximum | 40.5% | 93.0% |
| Range | 39.4% | 90.9% |
| Mean | 16.9% | 18.9% |
| Median | 16.4% | 16.8% |
| Interquartile 25% (IQ1) | 10.3% | 10.7% |
| Interquartile 75% (IQ3) | 20.8% | 22.9% |
| Interquartile Range (IQR) | 10.5% | 12.2% |
| Standard Deviation (Sample) | 8.8% | 14.4% |
| Standard Deviation (Population) | 8.7% | 14.3% |
Demographics Similar to Immigrants from Portugal and Panamanians by Child Poverty Under the Age of 16
In terms of child poverty under the age of 16, the demographic groups most similar to Immigrants from Portugal are Immigrants from Costa Rica (16.6%, a difference of 0.060%), Immigrants from Iraq (16.7%, a difference of 0.25%), Spanish (16.7%, a difference of 0.82%), Spaniard (16.8%, a difference of 1.0%), and Immigrants from Uruguay (16.8%, a difference of 1.1%). Similarly, the demographic groups most similar to Panamanians are Pennsylvania German (17.4%, a difference of 0.25%), German Russian (17.4%, a difference of 0.66%), Alaska Native (17.2%, a difference of 1.7%), Aleut (17.1%, a difference of 2.2%), and Hmong (17.1%, a difference of 2.2%).
| Demographics | Rating | Rank | Child Poverty Under the Age of 16 |
| Immigrants | Portugal | 30.0 /100 | #189 | Fair 16.6% |
| Immigrants | Costa Rica | 29.6 /100 | #190 | Fair 16.6% |
| Immigrants | Iraq | 28.3 /100 | #191 | Fair 16.7% |
| Spanish | 24.5 /100 | #192 | Fair 16.7% |
| Spaniards | 23.2 /100 | #193 | Fair 16.8% |
| Immigrants | Uruguay | 23.1 /100 | #194 | Fair 16.8% |
| Immigrants | Uganda | 22.5 /100 | #195 | Fair 16.8% |
| Immigrants | Lebanon | 22.0 /100 | #196 | Fair 16.8% |
| Immigrants | Kenya | 19.1 /100 | #197 | Poor 16.9% |
| Delaware | 17.1 /100 | #198 | Poor 17.0% |
| Immigrants | Afghanistan | 15.1 /100 | #199 | Poor 17.0% |
| Immigrants | Cameroon | 14.7 /100 | #200 | Poor 17.1% |
| Immigrants | Uzbekistan | 14.7 /100 | #201 | Poor 17.1% |
| Ugandans | 14.3 /100 | #202 | Poor 17.1% |
| Immigrants | Sierra Leone | 14.2 /100 | #203 | Poor 17.1% |
| Hmong | 14.0 /100 | #204 | Poor 17.1% |
| Aleuts | 13.9 /100 | #205 | Poor 17.1% |
| Alaska Natives | 11.8 /100 | #206 | Poor 17.2% |
| German Russians | 8.6 /100 | #207 | Tragic 17.4% |
| Pennsylvania Germans | 7.5 /100 | #208 | Tragic 17.4% |
| Panamanians | 6.9 /100 | #209 | Tragic 17.5% |