Immigrants from Portugal vs Hmong Child Poverty Under the Age of 16
COMPARE
Immigrants from Portugal
Hmong
Child Poverty Under the Age of 16
Child Poverty Under the Age of 16 Comparison
Immigrants from Portugal
Hmong
16.6%
CHILD POVERTY UNDER THE AGE OF 16
30.0/ 100
METRIC RATING
189th/ 347
METRIC RANK
17.1%
CHILD POVERTY UNDER THE AGE OF 16
14.0/ 100
METRIC RATING
204th/ 347
METRIC RANK
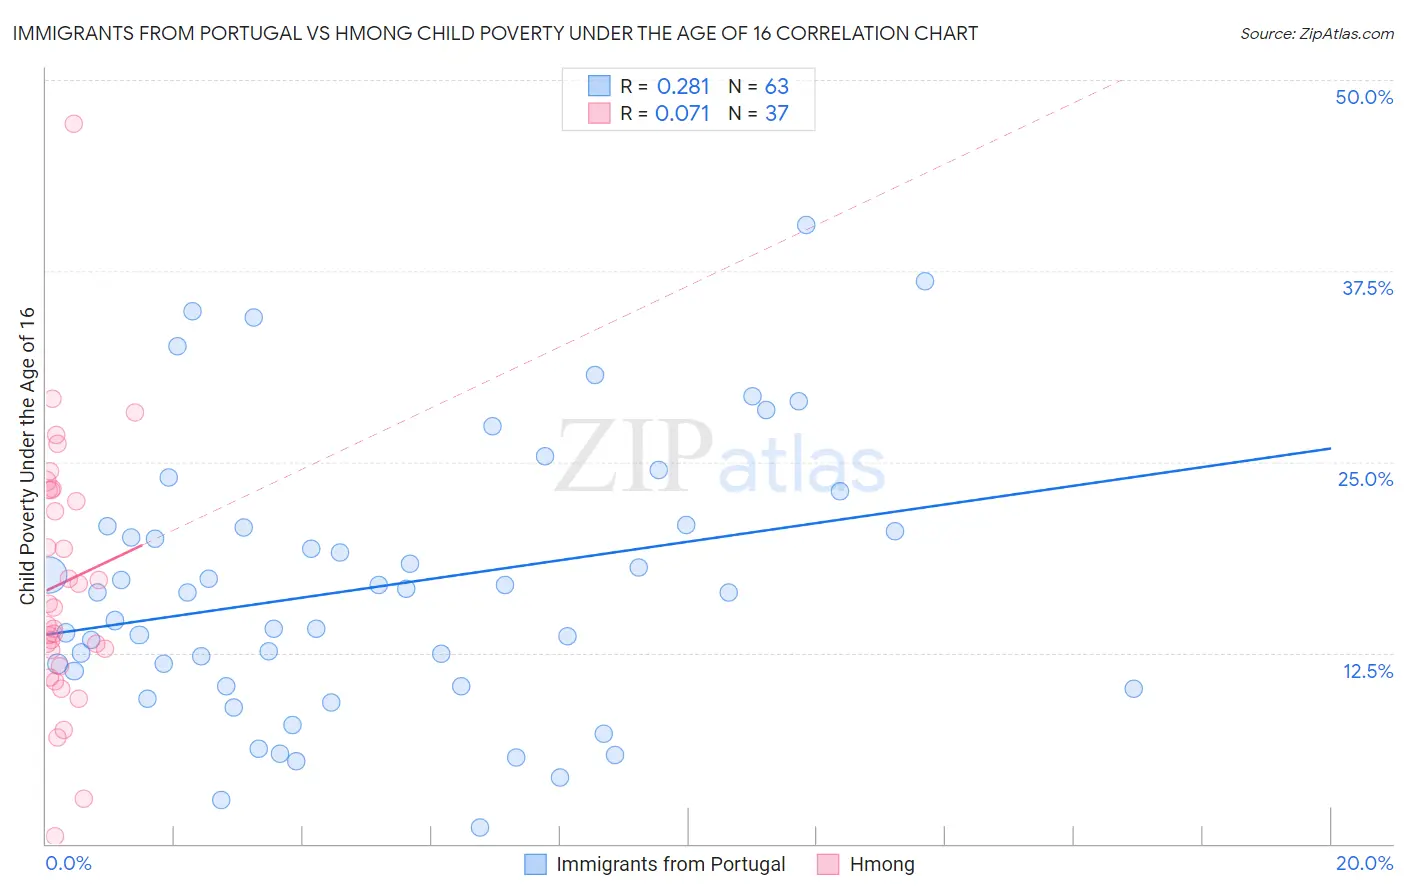
Immigrants from Portugal vs Hmong Child Poverty Under the Age of 16 Correlation Chart
The statistical analysis conducted on geographies consisting of 173,575,253 people shows a weak positive correlation between the proportion of Immigrants from Portugal and poverty level among children under the age of 16 in the United States with a correlation coefficient (R) of 0.281 and weighted average of 16.6%. Similarly, the statistical analysis conducted on geographies consisting of 24,652,508 people shows a slight positive correlation between the proportion of Hmong and poverty level among children under the age of 16 in the United States with a correlation coefficient (R) of 0.071 and weighted average of 17.1%, a difference of 2.8%.
Child Poverty Under the Age of 16 Correlation Summary
| Measurement | Immigrants from Portugal | Hmong |
| Minimum | 1.1% | 0.48% |
| Maximum | 40.5% | 47.2% |
| Range | 39.4% | 46.7% |
| Mean | 16.9% | 17.1% |
| Median | 16.4% | 15.5% |
| Interquartile 25% (IQ1) | 10.3% | 12.1% |
| Interquartile 75% (IQ3) | 20.8% | 23.2% |
| Interquartile Range (IQR) | 10.5% | 11.0% |
| Standard Deviation (Sample) | 8.8% | 8.6% |
| Standard Deviation (Population) | 8.7% | 8.4% |
Demographics Similar to Immigrants from Portugal and Hmong by Child Poverty Under the Age of 16
In terms of child poverty under the age of 16, the demographic groups most similar to Immigrants from Portugal are Immigrants from Costa Rica (16.6%, a difference of 0.060%), Immigrants from Morocco (16.6%, a difference of 0.17%), Arab (16.6%, a difference of 0.19%), Immigrants from Iraq (16.7%, a difference of 0.25%), and Kenyan (16.5%, a difference of 0.55%). Similarly, the demographic groups most similar to Hmong are Aleut (17.1%, a difference of 0.010%), Immigrants from Sierra Leone (17.1%, a difference of 0.060%), Ugandan (17.1%, a difference of 0.080%), Immigrants from Uzbekistan (17.1%, a difference of 0.16%), and Immigrants from Cameroon (17.1%, a difference of 0.17%).
| Demographics | Rating | Rank | Child Poverty Under the Age of 16 |
| Kenyans | 34.1 /100 | #186 | Fair 16.5% |
| Arabs | 31.4 /100 | #187 | Fair 16.6% |
| Immigrants | Morocco | 31.2 /100 | #188 | Fair 16.6% |
| Immigrants | Portugal | 30.0 /100 | #189 | Fair 16.6% |
| Immigrants | Costa Rica | 29.6 /100 | #190 | Fair 16.6% |
| Immigrants | Iraq | 28.3 /100 | #191 | Fair 16.7% |
| Spanish | 24.5 /100 | #192 | Fair 16.7% |
| Spaniards | 23.2 /100 | #193 | Fair 16.8% |
| Immigrants | Uruguay | 23.1 /100 | #194 | Fair 16.8% |
| Immigrants | Uganda | 22.5 /100 | #195 | Fair 16.8% |
| Immigrants | Lebanon | 22.0 /100 | #196 | Fair 16.8% |
| Immigrants | Kenya | 19.1 /100 | #197 | Poor 16.9% |
| Delaware | 17.1 /100 | #198 | Poor 17.0% |
| Immigrants | Afghanistan | 15.1 /100 | #199 | Poor 17.0% |
| Immigrants | Cameroon | 14.7 /100 | #200 | Poor 17.1% |
| Immigrants | Uzbekistan | 14.7 /100 | #201 | Poor 17.1% |
| Ugandans | 14.3 /100 | #202 | Poor 17.1% |
| Immigrants | Sierra Leone | 14.2 /100 | #203 | Poor 17.1% |
| Hmong | 14.0 /100 | #204 | Poor 17.1% |
| Aleuts | 13.9 /100 | #205 | Poor 17.1% |
| Alaska Natives | 11.8 /100 | #206 | Poor 17.2% |