Immigrants from Portugal vs Immigrants from India Child Poverty Among Girls Under 16
COMPARE
Immigrants from Portugal
Immigrants from India
Child Poverty Among Girls Under 16
Child Poverty Among Girls Under 16 Comparison
Immigrants from Portugal
Immigrants from India
16.6%
CHILD POVERTY AMONG GIRLS UNDER 16
42.5/ 100
METRIC RATING
183rd/ 347
METRIC RANK
11.0%
CHILD POVERTY AMONG GIRLS UNDER 16
100.0/ 100
METRIC RATING
1st/ 347
METRIC RANK
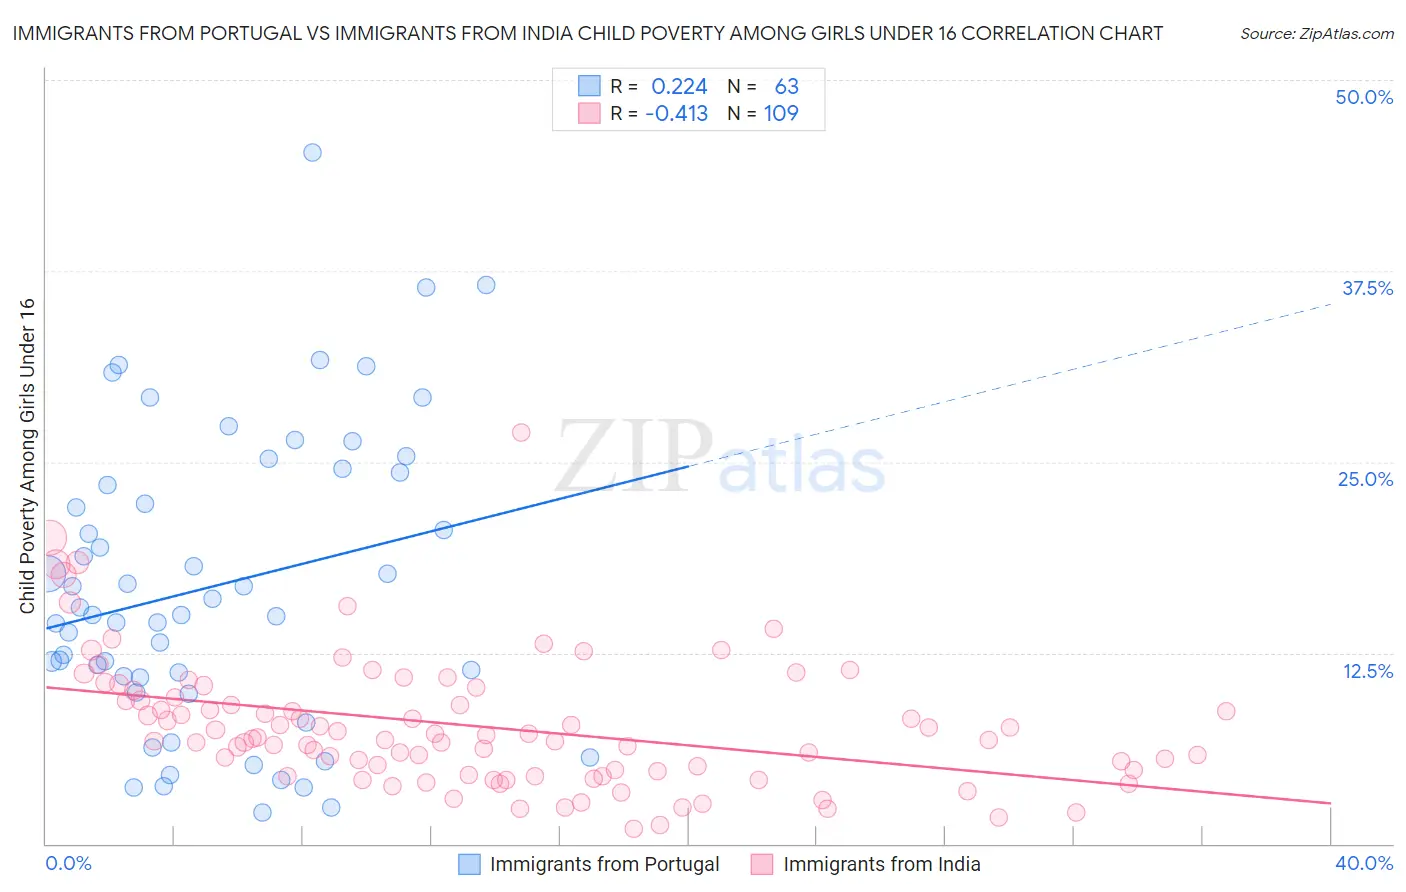
Immigrants from Portugal vs Immigrants from India Child Poverty Among Girls Under 16 Correlation Chart
The statistical analysis conducted on geographies consisting of 172,155,707 people shows a weak positive correlation between the proportion of Immigrants from Portugal and poverty level among girls under the age of 16 in the United States with a correlation coefficient (R) of 0.224 and weighted average of 16.6%. Similarly, the statistical analysis conducted on geographies consisting of 424,282,439 people shows a moderate negative correlation between the proportion of Immigrants from India and poverty level among girls under the age of 16 in the United States with a correlation coefficient (R) of -0.413 and weighted average of 11.0%, a difference of 50.7%.
Child Poverty Among Girls Under 16 Correlation Summary
| Measurement | Immigrants from Portugal | Immigrants from India |
| Minimum | 2.0% | 0.96% |
| Maximum | 45.2% | 26.9% |
| Range | 43.2% | 26.0% |
| Mean | 16.9% | 7.7% |
| Median | 15.0% | 6.9% |
| Interquartile 25% (IQ1) | 10.8% | 4.6% |
| Interquartile 75% (IQ3) | 24.3% | 9.8% |
| Interquartile Range (IQR) | 13.5% | 5.2% |
| Standard Deviation (Sample) | 9.6% | 4.3% |
| Standard Deviation (Population) | 9.6% | 4.3% |
Similar Demographics by Child Poverty Among Girls Under 16
Demographics Similar to Immigrants from Portugal by Child Poverty Among Girls Under 16
In terms of child poverty among girls under 16, the demographic groups most similar to Immigrants from Portugal are Immigrants from Ethiopia (16.6%, a difference of 0.070%), Immigrants from Iraq (16.6%, a difference of 0.080%), Immigrants from Syria (16.6%, a difference of 0.10%), Hawaiian (16.6%, a difference of 0.11%), and White/Caucasian (16.6%, a difference of 0.14%).
| Demographics | Rating | Rank | Child Poverty Among Girls Under 16 |
| Hungarians | 45.1 /100 | #176 | Average 16.6% |
| Immigrants | Western Asia | 44.1 /100 | #177 | Average 16.6% |
| Whites/Caucasians | 43.6 /100 | #178 | Average 16.6% |
| Hawaiians | 43.4 /100 | #179 | Average 16.6% |
| Immigrants | Syria | 43.3 /100 | #180 | Average 16.6% |
| Immigrants | Iraq | 43.2 /100 | #181 | Average 16.6% |
| Immigrants | Ethiopia | 43.1 /100 | #182 | Average 16.6% |
| Immigrants | Portugal | 42.5 /100 | #183 | Average 16.6% |
| Scotch-Irish | 39.6 /100 | #184 | Fair 16.7% |
| Immigrants | Uruguay | 35.6 /100 | #185 | Fair 16.7% |
| South American Indians | 35.0 /100 | #186 | Fair 16.8% |
| Immigrants | Morocco | 34.6 /100 | #187 | Fair 16.8% |
| Arabs | 34.5 /100 | #188 | Fair 16.8% |
| Immigrants | Bosnia and Herzegovina | 32.5 /100 | #189 | Fair 16.8% |
| Kenyans | 32.3 /100 | #190 | Fair 16.8% |
Demographics Similar to Immigrants from India by Child Poverty Among Girls Under 16
In terms of child poverty among girls under 16, the demographic groups most similar to Immigrants from India are Immigrants from Taiwan (11.3%, a difference of 2.6%), Filipino (11.4%, a difference of 3.5%), Tsimshian (11.5%, a difference of 4.1%), Thai (11.8%, a difference of 7.2%), and Immigrants from Hong Kong (12.3%, a difference of 11.8%).
| Demographics | Rating | Rank | Child Poverty Among Girls Under 16 |
| Immigrants | India | 100.0 /100 | #1 | Exceptional 11.0% |
| Immigrants | Taiwan | 100.0 /100 | #2 | Exceptional 11.3% |
| Filipinos | 100.0 /100 | #3 | Exceptional 11.4% |
| Tsimshian | 100.0 /100 | #4 | Exceptional 11.5% |
| Thais | 100.0 /100 | #5 | Exceptional 11.8% |
| Immigrants | Hong Kong | 100.0 /100 | #6 | Exceptional 12.3% |
| Chinese | 100.0 /100 | #7 | Exceptional 12.3% |
| Iranians | 100.0 /100 | #8 | Exceptional 12.4% |
| Immigrants | Singapore | 100.0 /100 | #9 | Exceptional 12.5% |
| Immigrants | Iran | 100.0 /100 | #10 | Exceptional 12.6% |
| Immigrants | South Central Asia | 100.0 /100 | #11 | Exceptional 12.7% |
| Bhutanese | 100.0 /100 | #12 | Exceptional 12.7% |
| Immigrants | Ireland | 99.9 /100 | #13 | Exceptional 12.9% |
| Burmese | 99.9 /100 | #14 | Exceptional 13.0% |
| Okinawans | 99.9 /100 | #15 | Exceptional 13.0% |