Austrian vs Immigrants from Western Europe Child Poverty Among Boys Under 16
COMPARE
Austrian
Immigrants from Western Europe
Child Poverty Among Boys Under 16
Child Poverty Among Boys Under 16 Comparison
Austrians
Immigrants from Western Europe
14.8%
CHILD POVERTY AMONG BOYS UNDER 16
97.1/ 100
METRIC RATING
90th/ 347
METRIC RANK
15.4%
CHILD POVERTY AMONG BOYS UNDER 16
90.0/ 100
METRIC RATING
131st/ 347
METRIC RANK
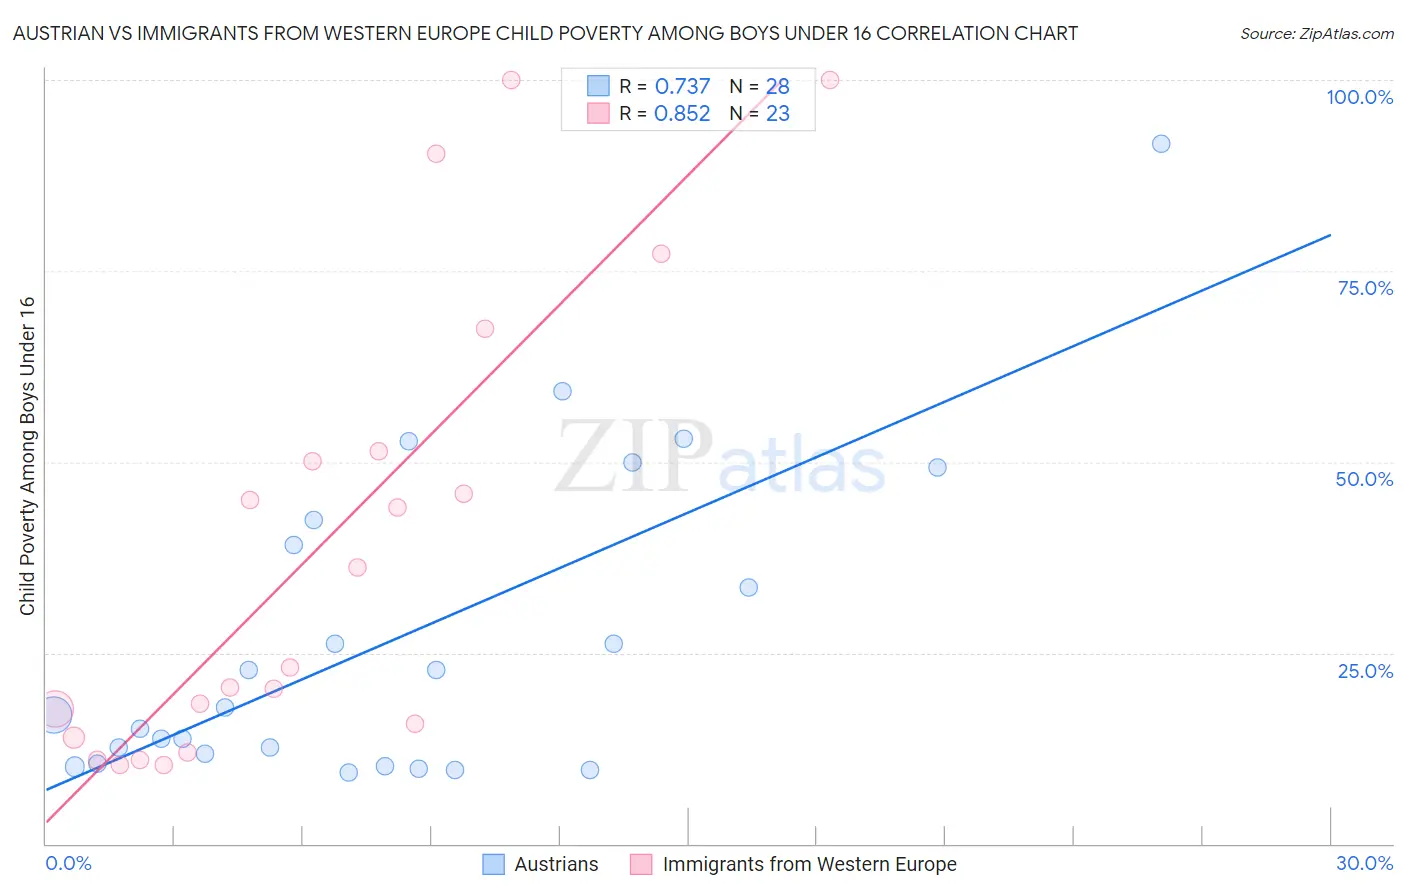
Austrian vs Immigrants from Western Europe Child Poverty Among Boys Under 16 Correlation Chart
The statistical analysis conducted on geographies consisting of 440,747,470 people shows a strong positive correlation between the proportion of Austrians and poverty level among boys under the age of 16 in the United States with a correlation coefficient (R) of 0.737 and weighted average of 14.8%. Similarly, the statistical analysis conducted on geographies consisting of 481,702,204 people shows a very strong positive correlation between the proportion of Immigrants from Western Europe and poverty level among boys under the age of 16 in the United States with a correlation coefficient (R) of 0.852 and weighted average of 15.4%, a difference of 4.0%.
Child Poverty Among Boys Under 16 Correlation Summary
| Measurement | Austrian | Immigrants from Western Europe |
| Minimum | 9.4% | 10.3% |
| Maximum | 91.7% | 100.0% |
| Range | 82.3% | 89.7% |
| Mean | 26.9% | 38.8% |
| Median | 17.4% | 23.0% |
| Interquartile 25% (IQ1) | 11.1% | 13.9% |
| Interquartile 75% (IQ3) | 40.8% | 51.3% |
| Interquartile Range (IQR) | 29.6% | 37.4% |
| Standard Deviation (Sample) | 20.6% | 29.9% |
| Standard Deviation (Population) | 20.2% | 29.3% |
Similar Demographics by Child Poverty Among Boys Under 16
Demographics Similar to Austrians by Child Poverty Among Boys Under 16
In terms of child poverty among boys under 16, the demographic groups most similar to Austrians are Immigrants from Argentina (14.8%, a difference of 0.010%), Immigrants from North America (14.8%, a difference of 0.090%), Northern European (14.8%, a difference of 0.10%), German (14.8%, a difference of 0.15%), and Taiwanese (14.8%, a difference of 0.22%).
| Demographics | Rating | Rank | Child Poverty Among Boys Under 16 |
| Immigrants | South Africa | 97.4 /100 | #83 | Exceptional 14.8% |
| Swiss | 97.3 /100 | #84 | Exceptional 14.8% |
| Taiwanese | 97.3 /100 | #85 | Exceptional 14.8% |
| Germans | 97.2 /100 | #86 | Exceptional 14.8% |
| Northern Europeans | 97.2 /100 | #87 | Exceptional 14.8% |
| Immigrants | North America | 97.1 /100 | #88 | Exceptional 14.8% |
| Immigrants | Argentina | 97.1 /100 | #89 | Exceptional 14.8% |
| Austrians | 97.1 /100 | #90 | Exceptional 14.8% |
| Paraguayans | 96.8 /100 | #91 | Exceptional 14.9% |
| Argentineans | 96.7 /100 | #92 | Exceptional 14.9% |
| Sri Lankans | 96.7 /100 | #93 | Exceptional 14.9% |
| Immigrants | Italy | 96.7 /100 | #94 | Exceptional 14.9% |
| Finns | 96.5 /100 | #95 | Exceptional 14.9% |
| Immigrants | North Macedonia | 96.3 /100 | #96 | Exceptional 14.9% |
| Immigrants | Egypt | 96.2 /100 | #97 | Exceptional 14.9% |
Demographics Similar to Immigrants from Western Europe by Child Poverty Among Boys Under 16
In terms of child poverty among boys under 16, the demographic groups most similar to Immigrants from Western Europe are Mongolian (15.4%, a difference of 0.060%), Immigrants from Brazil (15.4%, a difference of 0.080%), Canadian (15.4%, a difference of 0.20%), Carpatho Rusyn (15.4%, a difference of 0.39%), and Palestinian (15.4%, a difference of 0.43%).
| Demographics | Rating | Rank | Child Poverty Among Boys Under 16 |
| Tlingit-Haida | 92.2 /100 | #124 | Exceptional 15.3% |
| Czechoslovakians | 92.1 /100 | #125 | Exceptional 15.3% |
| Palestinians | 91.3 /100 | #126 | Exceptional 15.4% |
| Carpatho Rusyns | 91.1 /100 | #127 | Exceptional 15.4% |
| Canadians | 90.6 /100 | #128 | Exceptional 15.4% |
| Immigrants | Brazil | 90.3 /100 | #129 | Exceptional 15.4% |
| Mongolians | 90.2 /100 | #130 | Exceptional 15.4% |
| Immigrants | Western Europe | 90.0 /100 | #131 | Exceptional 15.4% |
| Immigrants | Kazakhstan | 88.7 /100 | #132 | Excellent 15.5% |
| Welsh | 88.3 /100 | #133 | Excellent 15.5% |
| Peruvians | 88.1 /100 | #134 | Excellent 15.5% |
| Portuguese | 87.5 /100 | #135 | Excellent 15.5% |
| Icelanders | 87.5 /100 | #136 | Excellent 15.5% |
| Immigrants | Spain | 87.1 /100 | #137 | Excellent 15.6% |
| Immigrants | Southern Europe | 86.5 /100 | #138 | Excellent 15.6% |