Immigrants from Peru vs Immigrants from Malaysia Single Female Poverty
COMPARE
Immigrants from Peru
Immigrants from Malaysia
Single Female Poverty
Single Female Poverty Comparison
Immigrants from Peru
Immigrants from Malaysia
19.3%
SINGLE FEMALE POVERTY
99.4/ 100
METRIC RATING
73rd/ 347
METRIC RANK
19.4%
SINGLE FEMALE POVERTY
99.2/ 100
METRIC RATING
82nd/ 347
METRIC RANK
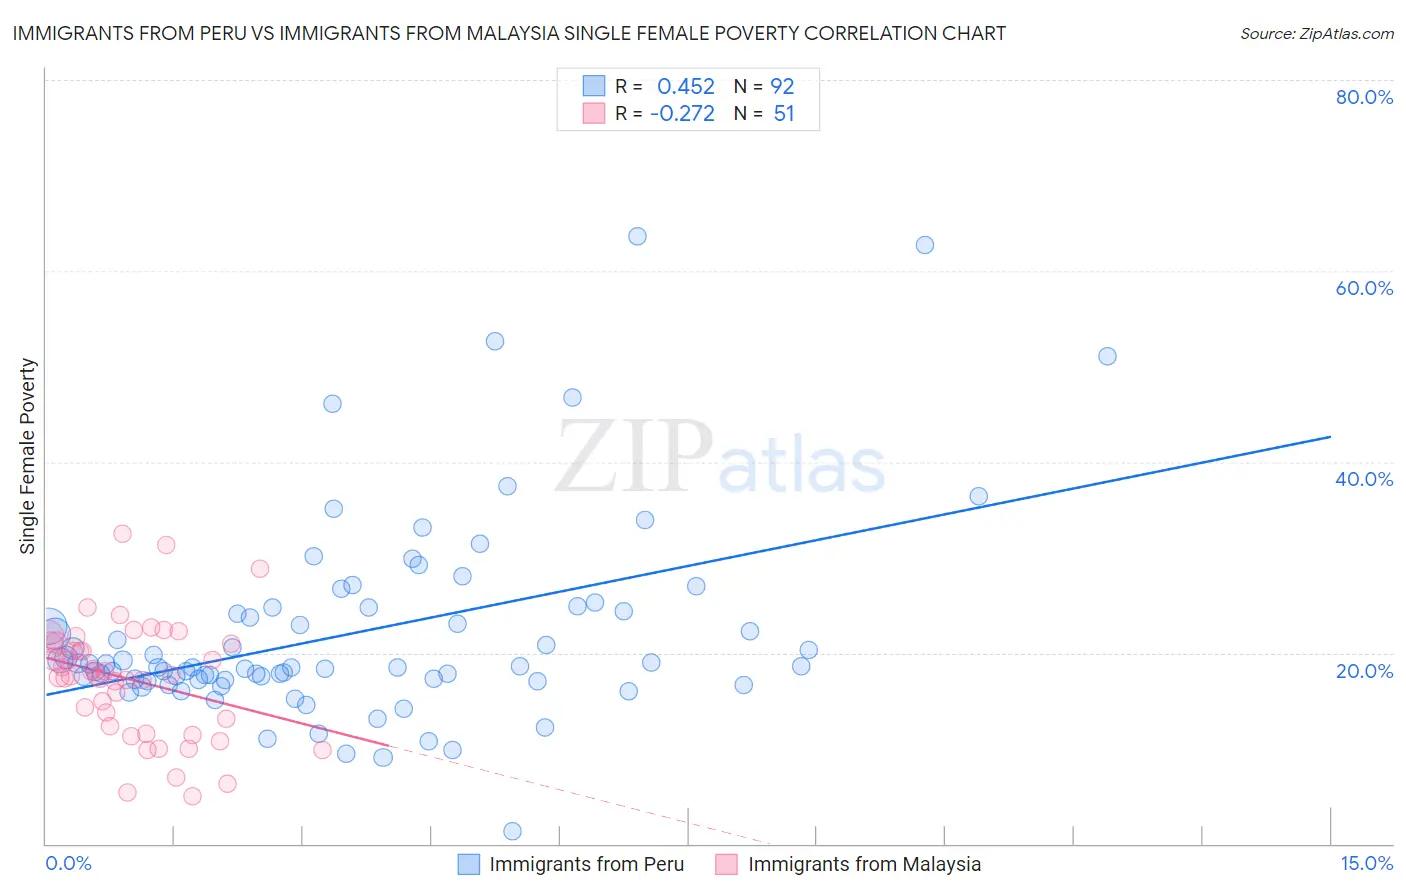
Immigrants from Peru vs Immigrants from Malaysia Single Female Poverty Correlation Chart
The statistical analysis conducted on geographies consisting of 325,235,635 people shows a moderate positive correlation between the proportion of Immigrants from Peru and poverty level among single females in the United States with a correlation coefficient (R) of 0.452 and weighted average of 19.3%. Similarly, the statistical analysis conducted on geographies consisting of 196,207,874 people shows a weak negative correlation between the proportion of Immigrants from Malaysia and poverty level among single females in the United States with a correlation coefficient (R) of -0.272 and weighted average of 19.4%, a difference of 0.38%.
Single Female Poverty Correlation Summary
| Measurement | Immigrants from Peru | Immigrants from Malaysia |
| Minimum | 1.3% | 5.0% |
| Maximum | 63.6% | 32.5% |
| Range | 62.3% | 27.5% |
| Mean | 22.1% | 17.2% |
| Median | 18.5% | 17.6% |
| Interquartile 25% (IQ1) | 17.2% | 12.3% |
| Interquartile 75% (IQ3) | 24.5% | 20.9% |
| Interquartile Range (IQR) | 7.3% | 8.6% |
| Standard Deviation (Sample) | 10.5% | 6.1% |
| Standard Deviation (Population) | 10.5% | 6.0% |
Demographics Similar to Immigrants from Peru and Immigrants from Malaysia by Single Female Poverty
In terms of single female poverty, the demographic groups most similar to Immigrants from Peru are Immigrants from Belarus (19.3%, a difference of 0.010%), Immigrants from Turkey (19.4%, a difference of 0.050%), Peruvian (19.4%, a difference of 0.090%), Immigrants from South Eastern Asia (19.3%, a difference of 0.10%), and Immigrants from Latvia (19.3%, a difference of 0.10%). Similarly, the demographic groups most similar to Immigrants from Malaysia are Immigrants from Scotland (19.4%, a difference of 0.010%), Taiwanese (19.4%, a difference of 0.010%), Immigrants from Australia (19.4%, a difference of 0.030%), Immigrants from Sierra Leone (19.4%, a difference of 0.070%), and Albanian (19.4%, a difference of 0.090%).
| Demographics | Rating | Rank | Single Female Poverty |
| Immigrants | Egypt | 99.6 /100 | #67 | Exceptional 19.2% |
| Laotians | 99.5 /100 | #68 | Exceptional 19.3% |
| Paraguayans | 99.5 /100 | #69 | Exceptional 19.3% |
| Immigrants | Jordan | 99.4 /100 | #70 | Exceptional 19.3% |
| Immigrants | South Eastern Asia | 99.4 /100 | #71 | Exceptional 19.3% |
| Immigrants | Latvia | 99.4 /100 | #72 | Exceptional 19.3% |
| Immigrants | Peru | 99.4 /100 | #73 | Exceptional 19.3% |
| Immigrants | Belarus | 99.4 /100 | #74 | Exceptional 19.3% |
| Immigrants | Turkey | 99.4 /100 | #75 | Exceptional 19.4% |
| Peruvians | 99.4 /100 | #76 | Exceptional 19.4% |
| Immigrants | Russia | 99.3 /100 | #77 | Exceptional 19.4% |
| Albanians | 99.3 /100 | #78 | Exceptional 19.4% |
| Immigrants | Sierra Leone | 99.3 /100 | #79 | Exceptional 19.4% |
| Immigrants | Australia | 99.3 /100 | #80 | Exceptional 19.4% |
| Immigrants | Scotland | 99.2 /100 | #81 | Exceptional 19.4% |
| Immigrants | Malaysia | 99.2 /100 | #82 | Exceptional 19.4% |
| Taiwanese | 99.2 /100 | #83 | Exceptional 19.4% |
| Immigrants | Sweden | 99.2 /100 | #84 | Exceptional 19.4% |
| Immigrants | Albania | 99.2 /100 | #85 | Exceptional 19.4% |
| Greeks | 99.2 /100 | #86 | Exceptional 19.4% |
| Zimbabweans | 99.0 /100 | #87 | Exceptional 19.5% |