Immigrants from Oceania vs Moroccan Child Poverty Under the Age of 16
COMPARE
Immigrants from Oceania
Moroccan
Child Poverty Under the Age of 16
Child Poverty Under the Age of 16 Comparison
Immigrants from Oceania
Moroccans
15.9%
CHILD POVERTY UNDER THE AGE OF 16
65.4/ 100
METRIC RATING
166th/ 347
METRIC RANK
17.6%
CHILD POVERTY UNDER THE AGE OF 16
5.3/ 100
METRIC RATING
218th/ 347
METRIC RANK
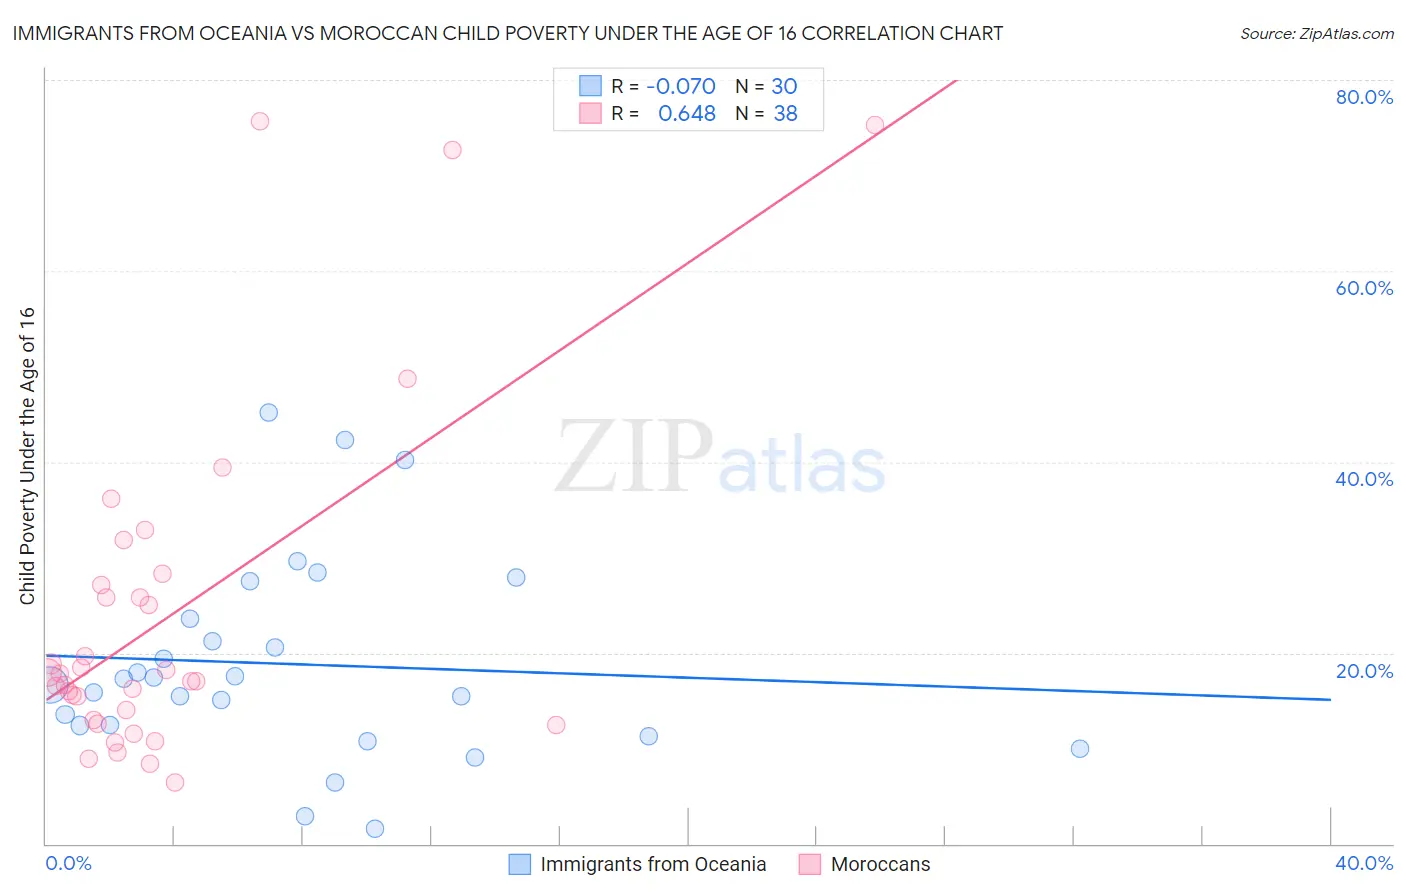
Immigrants from Oceania vs Moroccan Child Poverty Under the Age of 16 Correlation Chart
The statistical analysis conducted on geographies consisting of 303,303,395 people shows a slight negative correlation between the proportion of Immigrants from Oceania and poverty level among children under the age of 16 in the United States with a correlation coefficient (R) of -0.070 and weighted average of 15.9%. Similarly, the statistical analysis conducted on geographies consisting of 201,029,687 people shows a significant positive correlation between the proportion of Moroccans and poverty level among children under the age of 16 in the United States with a correlation coefficient (R) of 0.648 and weighted average of 17.6%, a difference of 10.8%.
Child Poverty Under the Age of 16 Correlation Summary
| Measurement | Immigrants from Oceania | Moroccan |
| Minimum | 1.6% | 6.5% |
| Maximum | 45.2% | 75.7% |
| Range | 43.6% | 69.2% |
| Mean | 18.8% | 23.8% |
| Median | 17.0% | 17.4% |
| Interquartile 25% (IQ1) | 12.4% | 13.0% |
| Interquartile 75% (IQ3) | 23.5% | 27.2% |
| Interquartile Range (IQR) | 11.1% | 14.2% |
| Standard Deviation (Sample) | 10.6% | 17.6% |
| Standard Deviation (Population) | 10.4% | 17.4% |
Similar Demographics by Child Poverty Under the Age of 16
Demographics Similar to Immigrants from Oceania by Child Poverty Under the Age of 16
In terms of child poverty under the age of 16, the demographic groups most similar to Immigrants from Oceania are Guamanian/Chamorro (15.9%, a difference of 0.13%), Immigrants from Germany (15.8%, a difference of 0.27%), Colombian (15.8%, a difference of 0.30%), Yugoslavian (15.8%, a difference of 0.30%), and Immigrants from Northern Africa (15.8%, a difference of 0.37%).
| Demographics | Rating | Rank | Child Poverty Under the Age of 16 |
| Immigrants | Fiji | 71.1 /100 | #159 | Good 15.8% |
| Immigrants | Albania | 70.7 /100 | #160 | Good 15.8% |
| Immigrants | Northern Africa | 68.1 /100 | #161 | Good 15.8% |
| Colombians | 67.6 /100 | #162 | Good 15.8% |
| Yugoslavians | 67.6 /100 | #163 | Good 15.8% |
| Immigrants | Germany | 67.3 /100 | #164 | Good 15.8% |
| Guamanians/Chamorros | 66.4 /100 | #165 | Good 15.9% |
| Immigrants | Oceania | 65.4 /100 | #166 | Good 15.9% |
| Costa Ricans | 61.1 /100 | #167 | Good 16.0% |
| South Americans | 57.9 /100 | #168 | Average 16.0% |
| Uruguayans | 54.7 /100 | #169 | Average 16.1% |
| Immigrants | Colombia | 54.4 /100 | #170 | Average 16.1% |
| Hungarians | 52.5 /100 | #171 | Average 16.2% |
| Afghans | 52.3 /100 | #172 | Average 16.2% |
| Immigrants | Saudi Arabia | 52.1 /100 | #173 | Average 16.2% |
Demographics Similar to Moroccans by Child Poverty Under the Age of 16
In terms of child poverty under the age of 16, the demographic groups most similar to Moroccans are Immigrants from Eastern Africa (17.6%, a difference of 0.010%), Sierra Leonean (17.6%, a difference of 0.19%), Malaysian (17.5%, a difference of 0.31%), Iraqi (17.5%, a difference of 0.33%), and Japanese (17.7%, a difference of 0.36%).
| Demographics | Rating | Rank | Child Poverty Under the Age of 16 |
| Immigrants | Thailand | 6.6 /100 | #211 | Tragic 17.5% |
| Immigrants | Immigrants | 6.5 /100 | #212 | Tragic 17.5% |
| Immigrants | Azores | 6.2 /100 | #213 | Tragic 17.5% |
| Iraqis | 5.9 /100 | #214 | Tragic 17.5% |
| Malaysians | 5.9 /100 | #215 | Tragic 17.5% |
| Sierra Leoneans | 5.7 /100 | #216 | Tragic 17.6% |
| Immigrants | Eastern Africa | 5.3 /100 | #217 | Tragic 17.6% |
| Moroccans | 5.3 /100 | #218 | Tragic 17.6% |
| Japanese | 4.7 /100 | #219 | Tragic 17.7% |
| Immigrants | Panama | 4.1 /100 | #220 | Tragic 17.7% |
| Cubans | 3.7 /100 | #221 | Tragic 17.8% |
| Immigrants | Armenia | 3.6 /100 | #222 | Tragic 17.8% |
| Immigrants | Cambodia | 3.3 /100 | #223 | Tragic 17.8% |
| Osage | 3.1 /100 | #224 | Tragic 17.9% |
| Immigrants | Nonimmigrants | 2.7 /100 | #225 | Tragic 17.9% |